


 52 / 70

52
TABLE 52. RACES, PRIZEMONEY AND FOAL CROPS 1992/93 – 2015/16
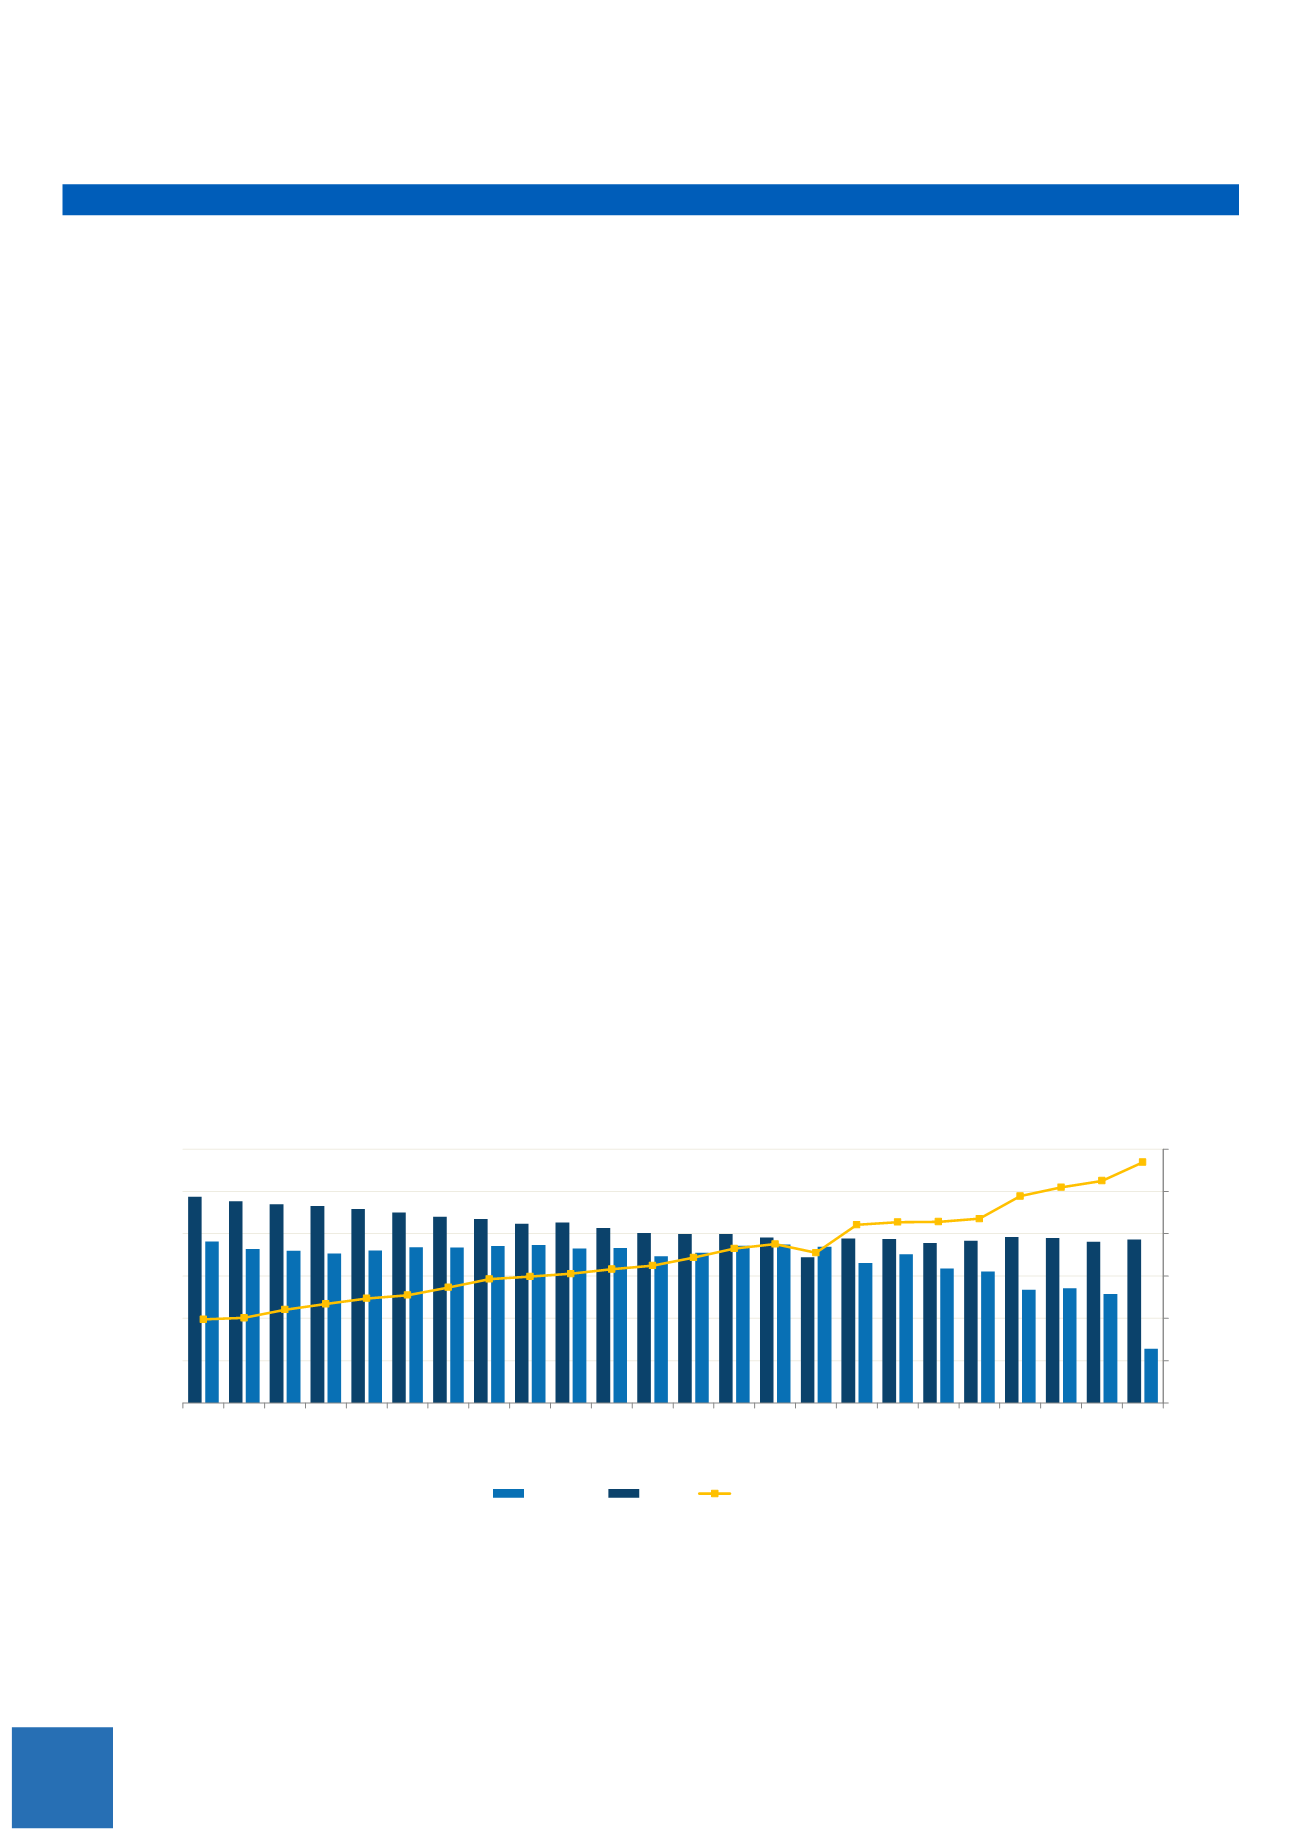
CHART 10. RACES, PRIZEMONEY AND FOAL CROPS 1992/93 – 2015/16
INDUSTRY TRENDS
Season
Foal Crop
% Change
Races
% Change
Prizemoney
% Change
2015/16
6,407
-50.22%
19,303
1.40%
$568,865,514
8.35%
2014/15
12,871
-5.04%
19,036
-2.43%
$525,015,476
3.03%
2013/14
13,554
1.41%
19,511
-0.59%
$509,566,525
4.27%
2012/13
13,365
-14.00%
19,626
2.39%
$488,709,074
12.25%
2011/12
15,540
-2.22%
19,168
1.48%
$435,385,165
1.64%
2010/11
15,893
-9.46%
18,888
-2.52%
$428,339,959
0.26%
2009/10
17,553
6.05%
19,376
-0.32%
$427,245,771
1.46%
2008/09
16,552
-10.43%
19,438
12.94%
$421,095,890
18.60%
2007/08
18,480
-1.48%
17,211
-11.94%
$355,043,530
-5.45%
2006/07
18,758
0.85%
19,545
-2.09%
$375,512,579
2.97%
2005/06
18,599
4.78%
19,963
-0.03%
$364,681,731
6.15%
2004/05
17,750
2.32%
19,968
-0.52%
$343,550,700
5.84%
2003/04
17,347
-5.29%
20,072
-3.04%
$324,586,453
2.74%
2002/03
18,316
0.41%
20,702
-2.92%
$315,933,356
3.49%
2001/02
18,242
-2.29%
21,324
0.63%
$305,293,254
2.24%
2000/01
18,670
0.66%
21,190
-2.64%
$298,592,625
1.95%
1999/00
18,548
1.05%
21,764
-1.15%
$292,869,666
7.18%
1998/99
18,355
-0.33%
22,018
-2.13%
$273,249,565
7.21%
1997/98
18,416
2.28%
22,498
-1.91%
$254,881,377
3.18%
1996/97
18,006
1.86%
22,935
-1.48%
$247,036,322
5.56%
1995/96
17,678
-1.64%
23,280
-0.95%
$234,020,189
6.13%
1994/95
17,972
-1.29%
23,503
-1.41%
$220,497,827
9.61%
1993/94
18,207
-4.58%
23,840
-2.26%
$201,174,190
1.88%
1992/93
19,080
-
24,390
-
$197,461,251
-
* The foal crop figure can't be supplied at this point in time as foals are still being born
Chart 10. Races, Prizemoney and Foal Crops 1992/93 – 2015/16
Foal Crop Races Prizemoney
2015/16
6,407 19,303 $568,865,514
2 14/15
12,871 19, 36 $525,015,476
2013/14
13,554 19,511 $509,566,525
2012/13
13,365 19,626 $488,709,074
2 11/12
15,540 19,168 $435,385,165
2010/11
15,893 18,888 $428,339,959
2009/10
17,553 19,376 $427,245,771
2008/09
16,552 19,438 $421,095,890
2007/ 8
18,480 17,211 $355,043,53
2006/07
18,758 19,545 $375,512,579
2005/06
18,599 19,963 $364,681,731
2004/05
17,750 19,968 $343,550,700
2003/04
17,347 20,072 $324,586,453
2002/03
18,316 20,702 $315,933,356
2001/02
18,242 21,324 $305,293,254
2000/01
18,670 21,190 $298,592,625
1999/00
18,548 21,764 $292,869,666
1998/99
18,355 22,018 $273,249,565
1 97/98
18,416 22,498 $254,881,377
1996/97
18,006 22,935 $247,036,322
1995/96
17,678 23,280 $234,020,189
1994/95
17,972 23,503 $220,497,827
1993/94
18,207 23,840 $201,174,190
1992/93
19,080 24,390 $197,461,251
$0
$100,000,000
$200,000,000
$300,000,000
$400,000,000
$500,000,000
$600,000,000
0
5,000
10,000
15,000
20,000
25,000
30,000
2015/16
2014/15
2013/14
2012/13
2011/12
2010/11
2009/10
2008/09
2007/08
2006/07
2005/06
2004/05
2003/04
2002/03
2001/02
2000/01
1999/00
1998/99
1997/98
1996/97
1995/96
1994/95
1993/94
1992/93
Foal Crop
Races
Prizemoney