
64
65
RACING AUSTRALIA FACT BOOK 2014/15
TABLE 79. TASMANIAN THOROUGHBRED WAGERING TURNOVER 2008/09 – 2014/15
TABLE 80. ACT THOROUGHBRED WAGERING TURNOVER 2008/09 – 2014/15
AUSTRALIAN THOROUGHBRED WAGERING TURNOVER
Wagering Form
2008/09 ($M) 2009/10 ($M) 2010/11 ($M)
2011/12 ($M)
2012/13 ($M) 2013/14 ($M)
2014/15 ($M)
TAB On Course
6.09
5.85
5.71
4.98
3.29
2.88
2.69
Retail
195.88
110.31
105.93
97.16
75.66
71.98
65.86
Phone
22.08
22.31
20.52
16.60
9.46
8.41
7.51
Internet
237.22
366.61
529.38
441.14
35.82
38.70
40.00
Total Off Course
455.18
499.23
655.83
554.90
120.94
119.09
113.37
Total Pari-Mutuel
461.27
505.08
661.54
559.88
124.23
121.97
116.06
Fixed Odds
6.72
4.66
4.42
13.00
46.44
71.99
100.35
Total TAB
467.99
509.74
665.96
572.88
170.67
193.96
216.41
Total Bookmakers
2.09
1.08
1.43
1.28
1.04
-
0.80
Corporate and Exchanges
-
-
-
-
-
-
86.06
TOTAL WAGERING
470.08
510.82
667.39
574.16
171.71
193.96
303.27
Wagering Form
2008/09 ($M)
2009/10 ($M) 2010/11 ($M)
2011/12 ($M)
2012/13 ($M) 2013/14 ($M)
2014/15 ($M)
TAB On Course
3.34
2.56
2.52
2.19
2.47
2.47
2.47
Retail
66.75
78.27
74.46
76.77
64.09
52.49
50.98
Phone
8.78
6.17
5.12
4.06
3.81
3.15
3.13
Internet
50.75
37.08
36.99
30.40
36.61
43.35
46.30
Total Off Course
126.28
121.52
116.57
111.23
104.51
98.99
100.41
Total Pari-Mutuel
129.62
124.08
119.09
113.42
106.98
101.46
102.88
Fixed Odds
1.10
2.77
2.93
4.87
6.93
13.46
11.89
Total TAB
130.72
126.85
122.02
118.29
113.91
114.92
114.77
Total Bookmakers
38.08
34.69
42.99
8.23
8.70
-
11.89
Corporate and Exchanges
-
-
-
-
-
-
43.93
TOTAL WAGERING
168.80
161.54
165.01
126.52
122.61
114.92
170.59
Wagering Form
2008/09 ($M) 2009/10 ($M) 2010/11 ($M)
2011/12 ($M)
2012/13 ($M)
2013/14 ($M)
2014/15 ($M)
TAB On Course
12.68
13.67
12.60
13.24
12.90
12.65
11.82
Retail
70.68
67.11
59.80
52.38
50.49
49.34
45.54
Phone
7.01
6.09
4.89
5.34
4.43
3.81
3.24
Internet
28.19
19.98
12.28
13.72
11.86
11.65
11.28
Total Off Course
105.88
93.18
76.97
71.44
66.78
64.80
60.06
Total Pari-Mutuel
118.56
106.85
89.57
84.68
79.68
77.45
71.88
Fixed Odds
2.28
17.10
48.67
52.13
59.63
64.77
64.77
Total TAB
120.84
123.95
138.24
136.81
139.31
142.22
136.65
Total Bookmakers
9.45
11.34
10.51
9.88
8.37
-
4.05
Corporate and Exchanges
-
-
-
-
-
-
27.51
TOTAL WAGERING
130.29
135.29
148.75
146.69
147.68
142.22
168.21
Note: Bookmaker phone and Internet splits have been estimated based on total phone and Internet figures
TABLE 81. NT THOROUGHBRED WAGERING TURNOVER 2008/09 – 2014/15
TABLE 82. THOROUGHBRED WAGERING TURNOVER 1996/97 – 2014/15
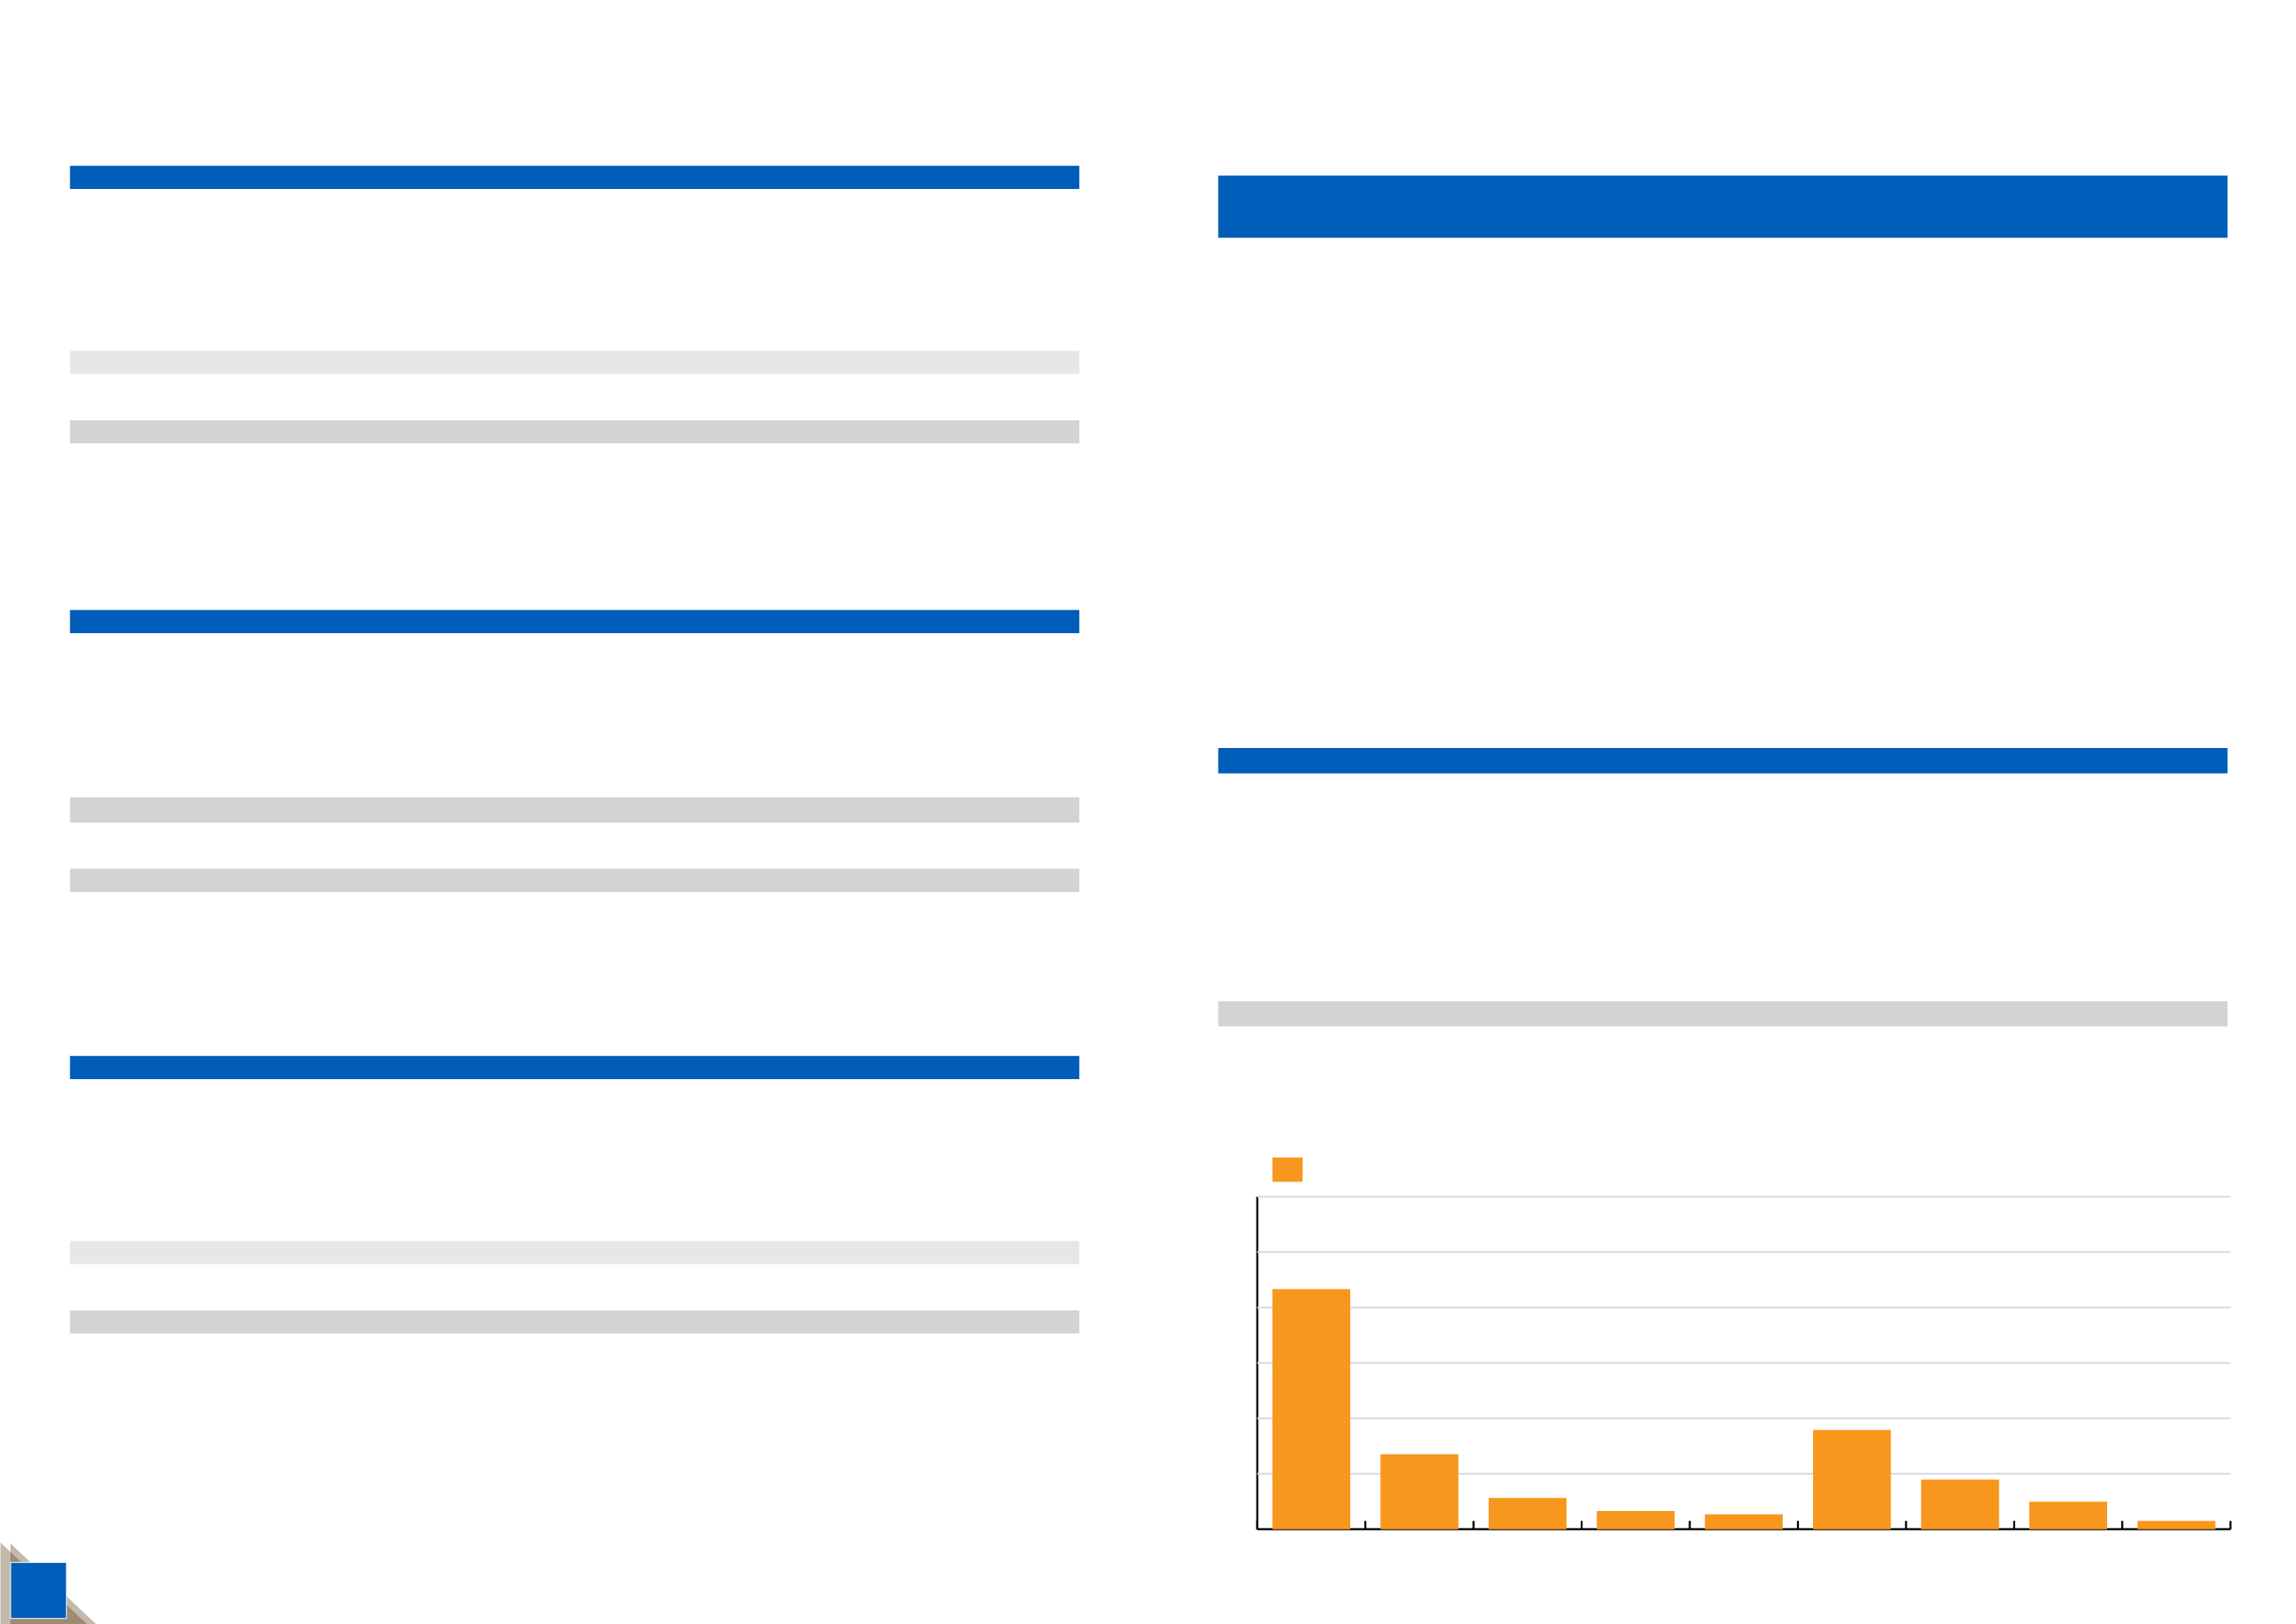
TABLE 83. ALL CODES PARI-MUTUEL BET TYPE DISTRIBUTION ($) IN 2014/15
CHART 13. PARI-MUTUEL BET TYPE
Year
Tote On
Course
($M)
TAB Retail
($M)
TAB Phone &
Internet ($M)
Fixed Odds Total TAB
($M)
Retail ($M)
Bookmakers
Phone &
Internet ($M)
Total
Bookmakers
($M)
Total
Wagering
($M)
2014/15
515.28
4,166.96
2,068.96
2,986.94
9,738.14
207.47
5,935.55
6,143.02
15,881.16
2013/14
550.95
4,479.24
1,974.55
2,644.17 9,648.93
324.07
5,625.72
5,949.79 15,598.72
2012/13
758.64
4,870.21
1,957.23
2,227.38 9,813.46
386.77
4,261.45
4,648.21
14,461.67
2011/12
813.69 5,226.59
2,364.24
1,868.12 10,272.65
426.88
3,676.96
4,103.84 14,376.49
2010/11
918.39 5,586.93
2,470.34
1,238.88 10,214.54
572.30
3,600.96
4,173.26
14,387.80
2009/10 994.97
6,143.53
2,352.28
581.13 10,071.91
613.00
3,710.39
4,323.39 14,395.30
2008/09 848.47
6,601.70
2,278.97
167.55 9,896.69
702.19
3,834.27
4,536.46
14,433.15
2007/08 704.50
6,234.40
2,015.40
97.10 9,051.40
640.63
3,266.70
3,907.33 12,958.73
2006/07
703.23
6,610.70
1,948.00
80.40 9,342.33
771.30
2,976.30
3,747.60 13,089.93
2005/06 584.51 6,386.00
1,754.00
68.30
8,792.81
852.24
2,029.31
2,881.55
11,674.36
2004/05 589.20 6,396.80
1,722.40
55.60 8,764.00
953.00
1,983.60
2,936.60
11,700.60
2003/04 591.63
6,167.20
1,602.89
46.50 8,408.23
999.44
1,742.73
2,742.16
11,150.39
2002/03 601.30 5,964.00
1,524.00
- 8,089.30
1,045.51
1,389.28
2,434.79 10,524.09
2001/02 560.00 6,235.00
1,026.07
-
7,821.07
1,217.00
625.00
1,842.00
9,663.07
2000/01
572.00 6,490.00
1,079.00
-
8,141.00
881.00
518.00
1,399.00
9,540.00
1999/00 612.00
6,897.00
-
- 7,509.00
1,070.00
397.00
1,467.00
8,976.00
1998/99 575.00
6,667.00
-
- 7,242.00
1,008.00
427.00
1,435.00
8,677.00
1997/98
617.00
6,659.00
-
- 7,276.00
997.00
406.00
1,403.00
8,679.00
Bet Type
NSW ($M)
VIC ($M)
QLD ($M)
SA ($M)
WA ($M)
TAS ($M)
ACT ($M)
NT ($M)
Australia ($M)
WIN
1,638.56
1,146.41
471.87
166.73
615.44
80.41
59.59
45.45
4,224.46
PLACE
489.67
392.66
187.47
61.15
259.59
30.81
18.38
12.45
1,452.18
QUINELLA
246.00
170.10
69.85
23.89
55.25
12.89
8.54
4.62
591.14
EXACTA
103.71
92.02
42.28
14.46
40.66
5.88
2.83
2.84
304.68
DOUBLES
68.24
112.59
20.92
7.90
14.74
5.03
4.63
0.73
234.78
TRIFECTA
495.19
473.13
315.17
100.22
385.81
32.33
24.95
23.98
1,850.78
FIRST FOUR
289.82
321.24
67.49
15.54
217.42
5.66
6.37
5.52
929.06
QUADRELLA
98.75
238.92
61.03
17.02
51.90
7.44
6.73
3.05
484.84
OTHER
42.28
47.99
45.98
14.07
12.56
3.90
0.56
1.91
169.25
Total TAB
3,472.22
2,995.06
1,282.06
420.98
1,653.35
184.35
132.58
100.55
10,241.15
Note: Not Including Fixed Odds
Other includes Big 6, Duet, Triwin, Treble, Favourite numbers etc
0
1000
2000
3000
4000
5000
6000
Turnover ($M)
OTHER
QUADRELLA
FIRST FOUR
TRIFECTA
DOUBLES
EXACTA
QUINELLA
PLACE
WIN


