
46
47
RACING AUSTRALIA FACT BOOK 2014/15
TABLE 48. TWO YEAR OLD SALES RESULTS 2001/02 - 2014/15
TABLE 49. BROODMARE SALES RESULTS 2001/02 - 2014/15
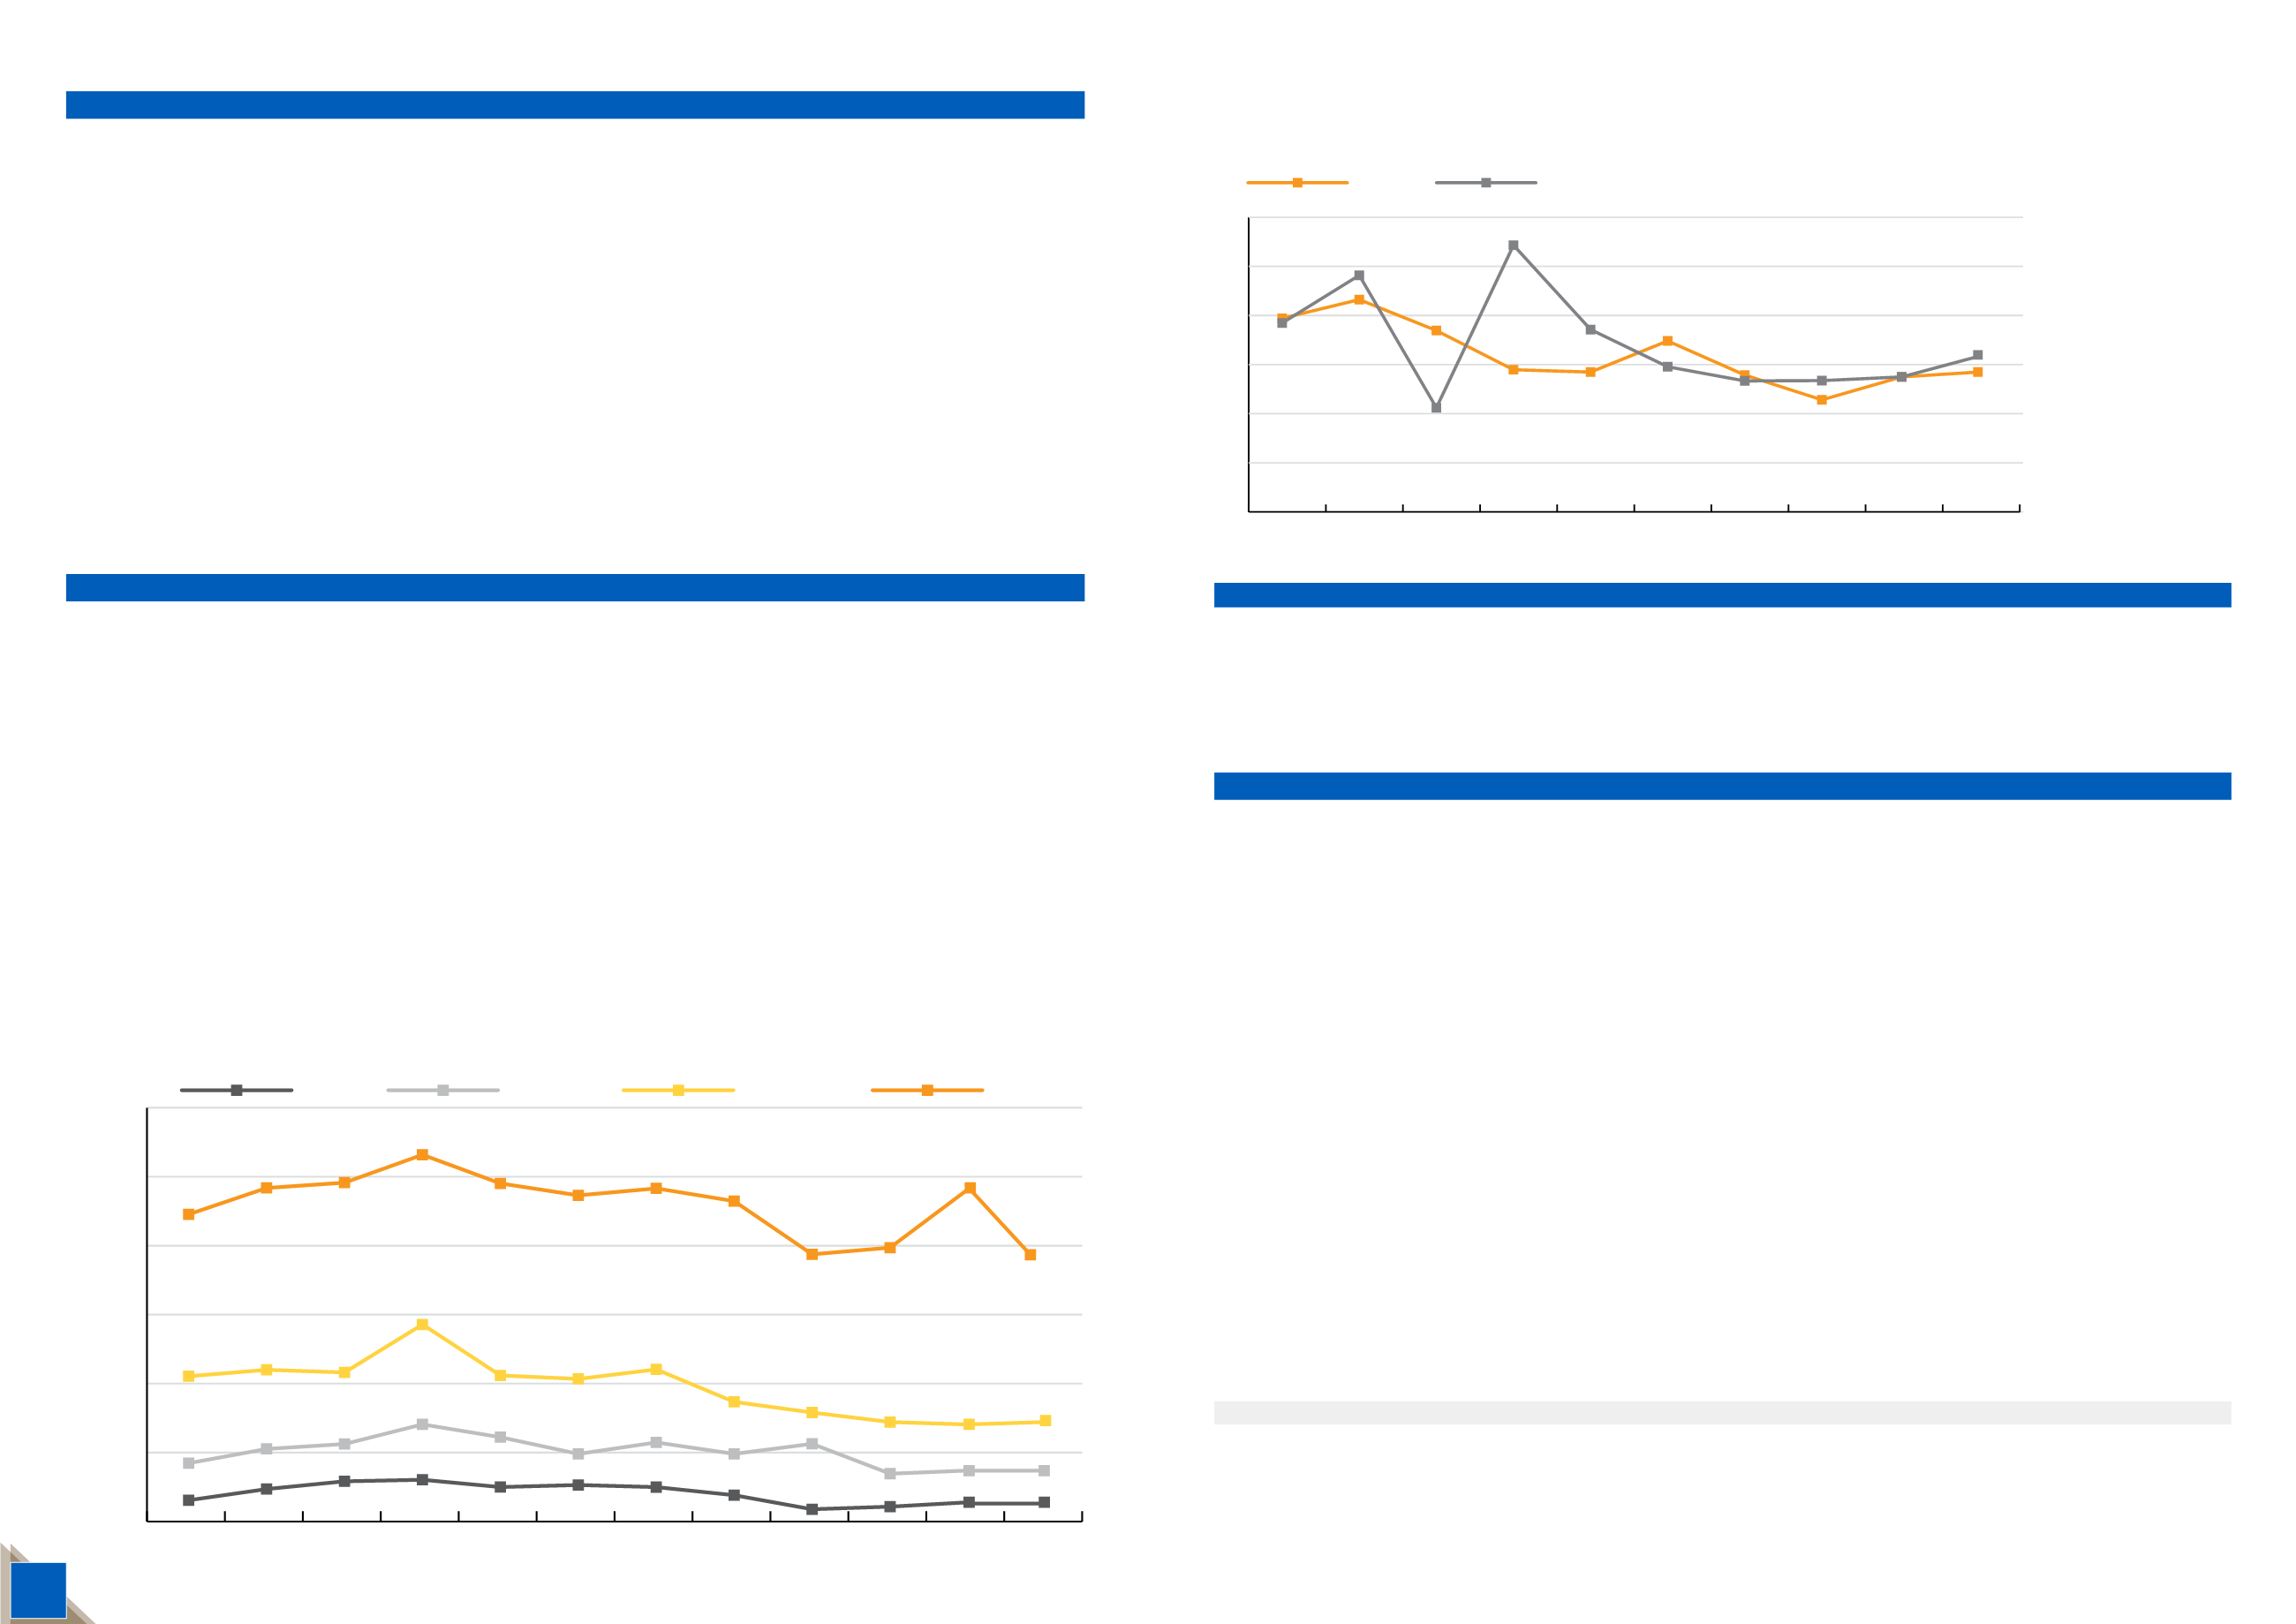
CHART 8. AUCTION RESULTS HORSES SOLD 2002/03 - 2014/15
Year
No. Sold
% Change Average ($)
% Change Gross ($)
% Change
Median ($)
% Change
2014/15
249
0%
$48,476
-10.71%
$12,070,500 -10.71%
$32,000
-15.78%
2013/14
249
15.27%
$54,295
35.13%
$13,519,800 53.71%
$38,000
40.74%
2012/13
216
21.30%
$40,179
-1.60%
$8,795,250 21.00%
$27,000
-10.00%
2011/12
178
-53.41%
$40,829
48.77%
$7,267,500 30.68%
$30,000
255.32%
2010/11
382
-23.40%
$27,444
14.90%
$10,483,650 -12.00%
$11,750
46.90%
2009/10
499
-5.80%
$23,887
1.20%
$11,919,700 -4.70%
$8,000
-33.30%
2008/09
530
6.00%
$23,602
-9.40%
$12,508,800 -4.00%
$12,000
-25.00%
2007/08
500
-17.50%
$26,060
15.00%
$13,030,150 -5.10%
$16,000
60.00%
2006/07
606
3.90%
$22,653
-3.40%
$13,727,600 0.40%
$10,000
-33.30%
2005/06
583
23.80%
$23,447
14.60%
$13,669,550 41.80%
$15,000
50.00%
2004/05
471
52.40%
$20,464
35.00%
$9,638,450 105.70%
$10,000
60.00%
2003/04
309
-8.80%
$15,161
-20.50%
$4,684,600 -27.50%
$6,250
-3.80%
2002/03
339
-5.00%
$19,066
-16.30%
$6,463,400 -20.50%
$6,500
-11.00%
2001/02
357
46.30%
$22,772
9.80%
$8,129,650 60.60%
$7,300
-27.00%
Year
No. Sold
% Change Average ($)
% Change Gross ($)
% Change
Median ($)
% Change
2014/15
1,377
1.69%
$60,975
-7.80%
$83,961,925 -6.23%
$13,000
18.18%
2013/14
1,354
-6.16%
$66,136
97.25%
$89,548,400 85.08%
$11,000
46.66%
2012/13
1,443
-8.70%
$33,528
9.10%
$48,380,825 -0.40%
$7,500
7.10%
2011/12
1,581
-8.88%
$30,720
17.80%
$48,567,800 7.35%
$7,000
55.55%
2010/11
1,735
-21.40%
$26,077
-3.00%
$45,243,350 -23.70%
$4,500
-10.00%
2009/10
2,206
6.70%
$26,883
7.80%
$59,303,650 15.00%
$5,000
11.10%
2008/09
2,068
-2.40%
$24,927
-51.00%
$51,549,659 -52.10%
$4,500
-28.00%
2007/08
2,118
-25.89%
$50,860
28.0%
$107,720,775 -5.14%
$6,250
-10.71%
2006/07
2,858
32.19%
$39,735
13.87%
$113,561,900 50.54%
$7,000
-6.67%
2005/06
2,162
-1.70%
$34,892
-14.00%
$75,435,500 -15.50%
$7,500
-16.70%
2004/05
2,200
4.40%
$40,574
73.50%
$89,262,075 81.20%
$9,000
73.10%
2003/04
2,107
10.60%
$23,385
25.40%
$49,271,950 38.70%
$5,200
30.00%
2002/03
1,905
1.40%
$18,643
-22.90%
$35,514,840 -21.80%
$4,000
-27.30%
2001/02
1,879
22.50%
$24,166
15.40%
$45,408,502 41.30%
$5,500
22.20%
Source:
www.bloodhound.net.auSource:
www.bloodhound.net.au2yo's
Weanlings
0
1000
2000
3000
4000
5000
6000
Broodmares
Yearlings
2012/13
2013/14 2014/15
2011/12
2010/11
2009/10
2008/09
2007/08
2006/07
2005/06
2004/05
2003/04
AUSTRALIAN IMPORTS & EXPORTS
TABLE 50. EXPORTED AND IMPORTED BLOODSTOCK 2005/06 - 2014/15
TABLE 51. AUSTRALIAN THOROUGHBRED EXPORTS BY COUNTRY 2005/06 – 2014/15
CHART 9. EXPORTS VS IMPORTS 2005/06 - 2014/15
2005/06 2006/07 2007/08 2008/09 2009/10 2010/11
2011/12 2012/13 2013/14 2014/15 Total
Exports 1,924
2,410
1,061
2,716
1,857
1,478
1,334
1,367
1,417
1,680
17,244
Imports 1,972
2,162
1,847
1,448
1,424
1,741
1,394
1,200
1,439
1,468
16,095
Country Exported To
2005-06 2006-07 2007-08 2008-09 2009-10 2010-11 2011-12 2012-13 2013-14 2014-15
ARGENTINA
-
-
1
11
-
6
-
-
-
-
CHINA
-
3
1
202
44
94
14
106
157
192
FRANCE
5
1
8
1
2
2
3
4
4
2
GREAT BRITAIN
27
24
25
16
29
14
8
24
21
17
HONG KONG
131
129
119
182
148
121
128
160
172
174
INDIA
-
2
1
-
2
-
-
-
-
-
INDONESIA
3
11
-
11
2
5
-
-
3
8
IRAN
6
6
42
3
3
-
-
-
-
1
IRELAND
23
29
24
32
19
17
22
18
23
28
ITALY
1
4
-
1
1
-
-
2
-
12
JAPAN
22
46
22
20
15
19
11
11
9
10
KOREA
184
200
94
121
64
45
37
33
27
60
LIBYA
-
-
-
-
18
-
3
-
-
3
MACAU
115
86
56
105
83
111
57
99
39
81
MALAYSIA
168
184
7
283
162
67
64
110
76
23
NEW CALEDONIA
6
3
2
8
-
2
11
-
17
37
NEW ZEALAND
723
1011
185
978
774
477
481
419
534
602
PHILIPPINES
108
184
143
145
62
71
99
59
13
54
SINGAPORE
206
214
190
379
269
284
233
224
191
195
SOUTH AFRICA
108
193
85
107
90
101
111
67
98
162
SPAIN
1
-
-
1
-
-
-
-
-
-
THAILAND
36
21
18
43
18
20
24
-
-
2
UNITED ARAB EMIRATES
13
23
1
13
26
3
4
8
7
1
USA
38
33
37
37
25
19
24
22
26
16
VENEZUELA
-
-
-
-
1
-
-
1
-
-
VIETNAM
-
3
-
17
-
-
-
-
-
-
TOTAL
1,924 2,410 1,061
2,716 1,857
1,478 1,334 1,367
1,417
1,680
Note: These figures only include permanently imported and exported Thoroughbreds
Source: Australian Stud Book at 31st October 2015
Please note: All figures are correct as of 31 October 2015
0
500
1000
1500
2000
2500
3000
Imports
Exports
2012/13
2013/14
2014/15
2011/12
2010/11
2009/10
2008/09
2007/08
2006/07
2005/06


