Australian Racing Fact Book 2012/13 33
Table 24. Stallion Distribution by State 2007/08 – 2012/13
Table 25. Broodmare Distribution by State 2007/08 – 2012/13
Table 26. Foal Distribution by State 2007/08 – 2012/13
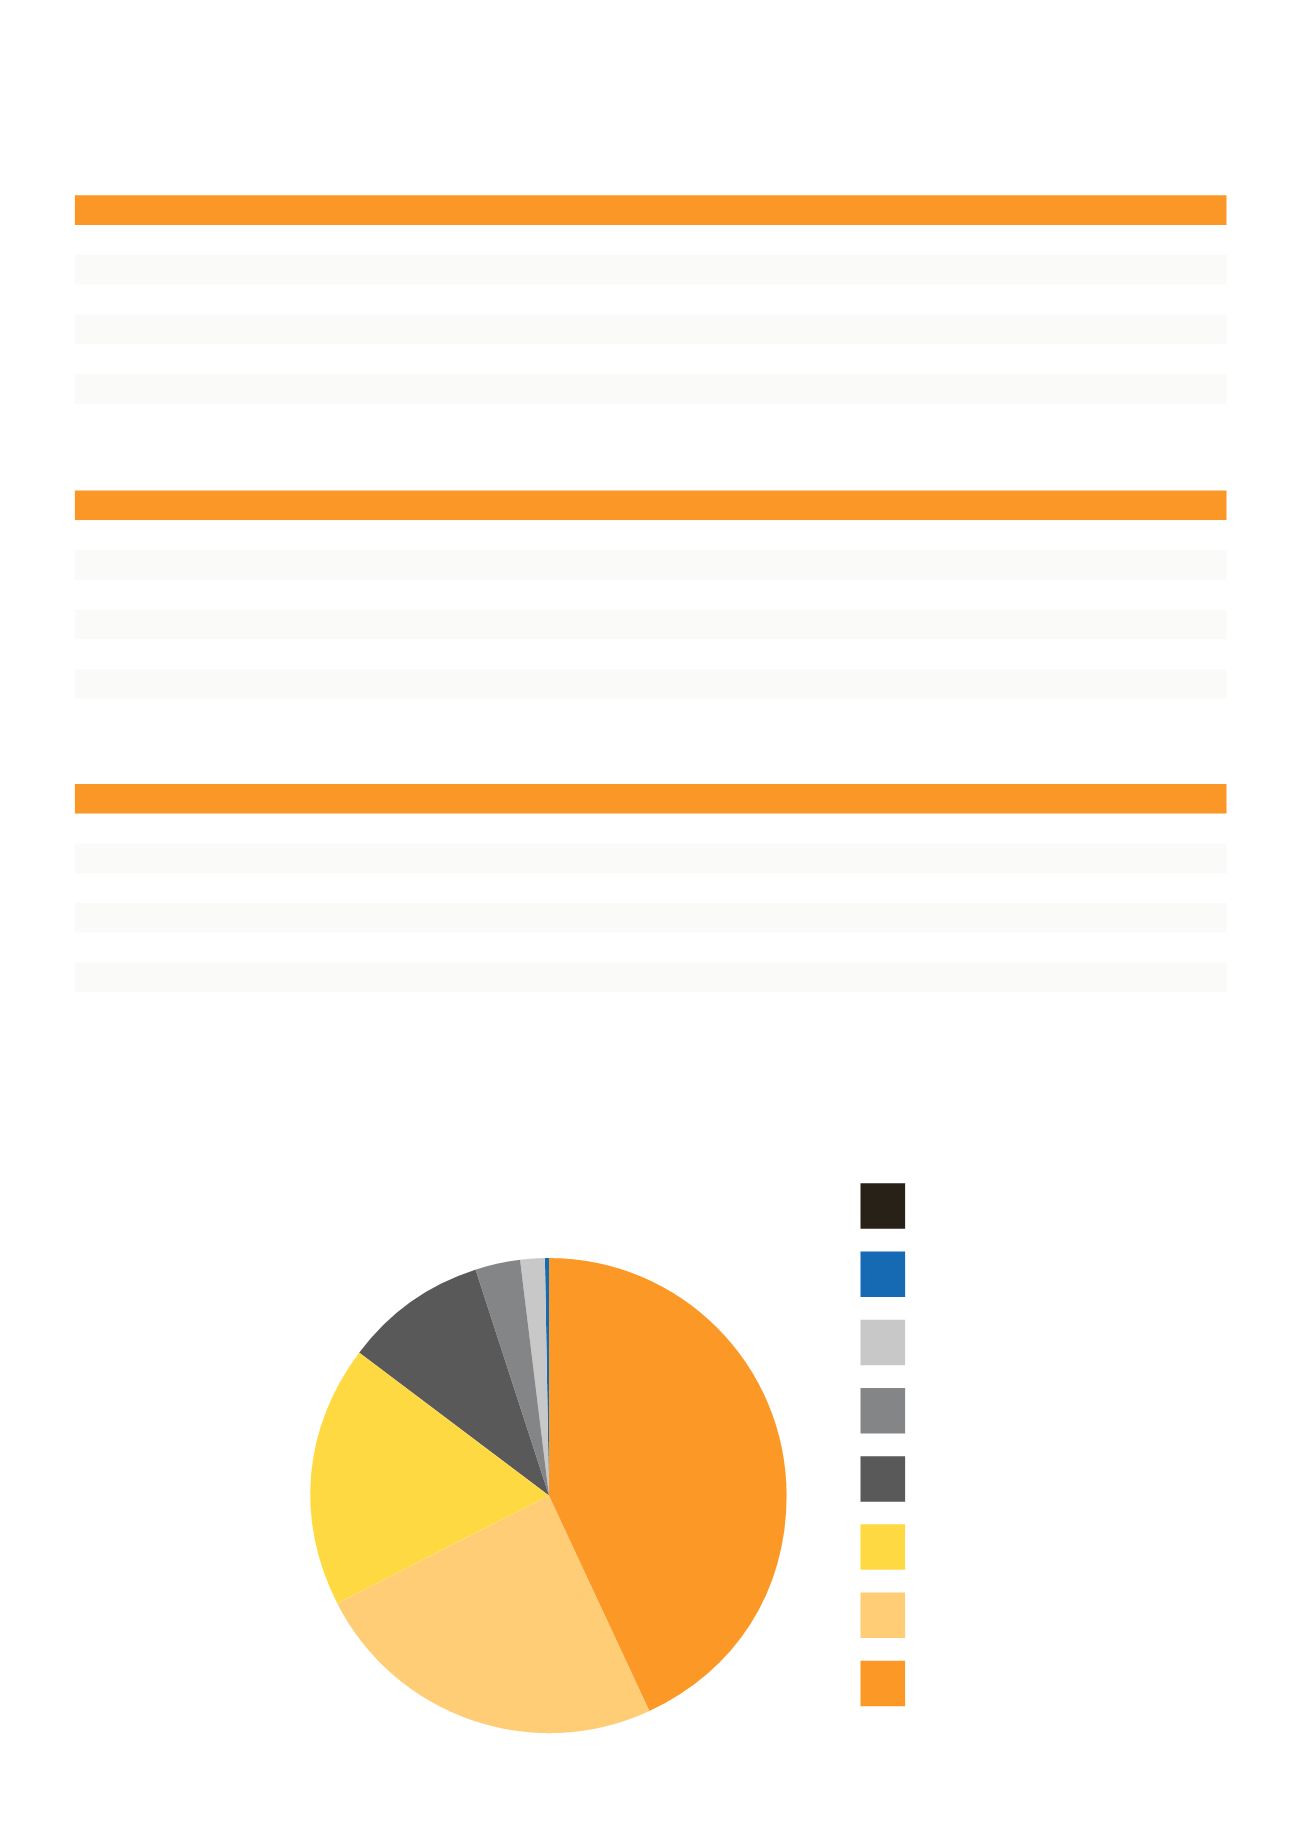
Chart 5. Australian Foal Crop Distribution 2012/13
Year
NSW
VIC
QLD
WA
SA
TAS
ACT
NT
Total
2012/13
242
169
181
81
30
23
1
1
728
2011/12
250
196
189
92
38
23
1
1
790
2010/11
260
195
211
94
36
25
1
1
823
2009/10
280
204
214
108
38
25
0
2
871
2008/09
293
208
217
102
45
22
1
3
891
2007/08
292
188
209
98
44
25
0
4
859
Year
NSW
VIC
QLD
WA
SA
TAS
ACT
NT
Total
2012/13
8,638
5,718
4,616
2,829
1,178
582
169
62
23,792
2011/12
8,638
5,718
4,616
2,829
1,178
582
169
62
23,792
2010/11
9,563
6,287
5,236
3,222
1,428
697
185
43
26,661
2009/10
9,993
6,620
5,646
3,463
1,544
750
182
40
28,238
2008/09
10,152
6,993
5,952
3,558
1,580
791
166
48
29,240
2007/08
10,631
7,100
6,204
3,581
1,673
810
154
51
30,204
Year
NSW
VIC
QLD
WA
SA
TAS
ACT
NT
Total
2012/13
6,294
3,537
2,604
1,407
452
251
15
2
14,562
2011/12
6,294
3,537
2,604
1,407
452
251
15
2
14,562
2010/11
6,856
3,748
2,759
1,745
631
328
15
1
16,083
2009/10
6,908
3,798
2,872
1,816
634
341
34
6
16,409
2008/09
7,301
4,204
3,316
1,903
681
332
36
5
17,778
2007/08
6,524
4,336
2,737
1,960
703
389
34
3
16,686
Source:
Please note: All figures are correct as of 31 July 2013
nt 0.0%
Act 0.1%
tAs 1.7%
sA 3.1%
WA 9.7%
QlD 17.9%
Vic 24.3%
nsW 43.2%


