Australian Racing Fact Book 2012/13 13
Group
& Listed Races
Table 5. Australian Group & Listed Statistics 2012/13
Table 6. Australian Group & Listed Statistics 2005/06 – 2012/13
NSW
VIC
QLD
SA
WA
TAS
ACT
Australia
Group 1
27
27
8
4
3
0
0
69
Group 1 P$
$20,400,000
$28,050,000
$4,810,000
$1,800,000
$2,000,000
$ -
$ -
$57,060,000
Group 2
31
35
9
3
6
0
0
84
Group 2 P$
$8,170,000
$8,170,000
$2,000,000
$825,000
$2,075,000
$ -
$ -
$21,240,000
Group 3
35
41
16
12
13
3
0
120
Group 3 P$
$4,790,000
$6,825,000
$2,330,000
$1,415,000
$1,900,000
$600,000
$ -
$17,860,000
Listed
73
94
52
28
53
13
4
317
Listed P$
$8,265,000
$12,320,000
$5,525,000
$2,300,000
$4,485,000
$1,250,000
$650,000
$34,795,000
G & L Races
166
197
85
47
75
16
4
590
G & L P$
$41,625,000
$55,365,000
$14,665,000
$6,340,000
$10,460,000
$1,850,000
$650,000
$130,955,000
2005/06
2006/07
2007/08
2008/09
2009/10
2010/11
2011/12
2012/13
Group 1 Races
66
67
62
67
68
68
68
69
Group 2 Races
80
78
73
83
85
85
84
84
Group 3 Races
111
114
94
110
112
116
120
120
Listed Races
285
279
266
282
289
291
303
317
Black Type Races
542
538
495
542
554
560
575
590
Group Race $P
$85,430,035
$87,982,890
$81,994,035
$89,814,585
$87,102,000
$92,710,000
$93,060,000
$96,160,000
Listed Race $P
$26,442,665
$25,869,805
$25,798,975
$29,164,355
$29,925,000
$31,181,500
$32,150,000
$34,795,000
Total Black Type
$111,872,700 $113,852,695 $107,793,010 $118,978,940 $117,027,000 $123,891,500 $125,210,000 $130,955,000
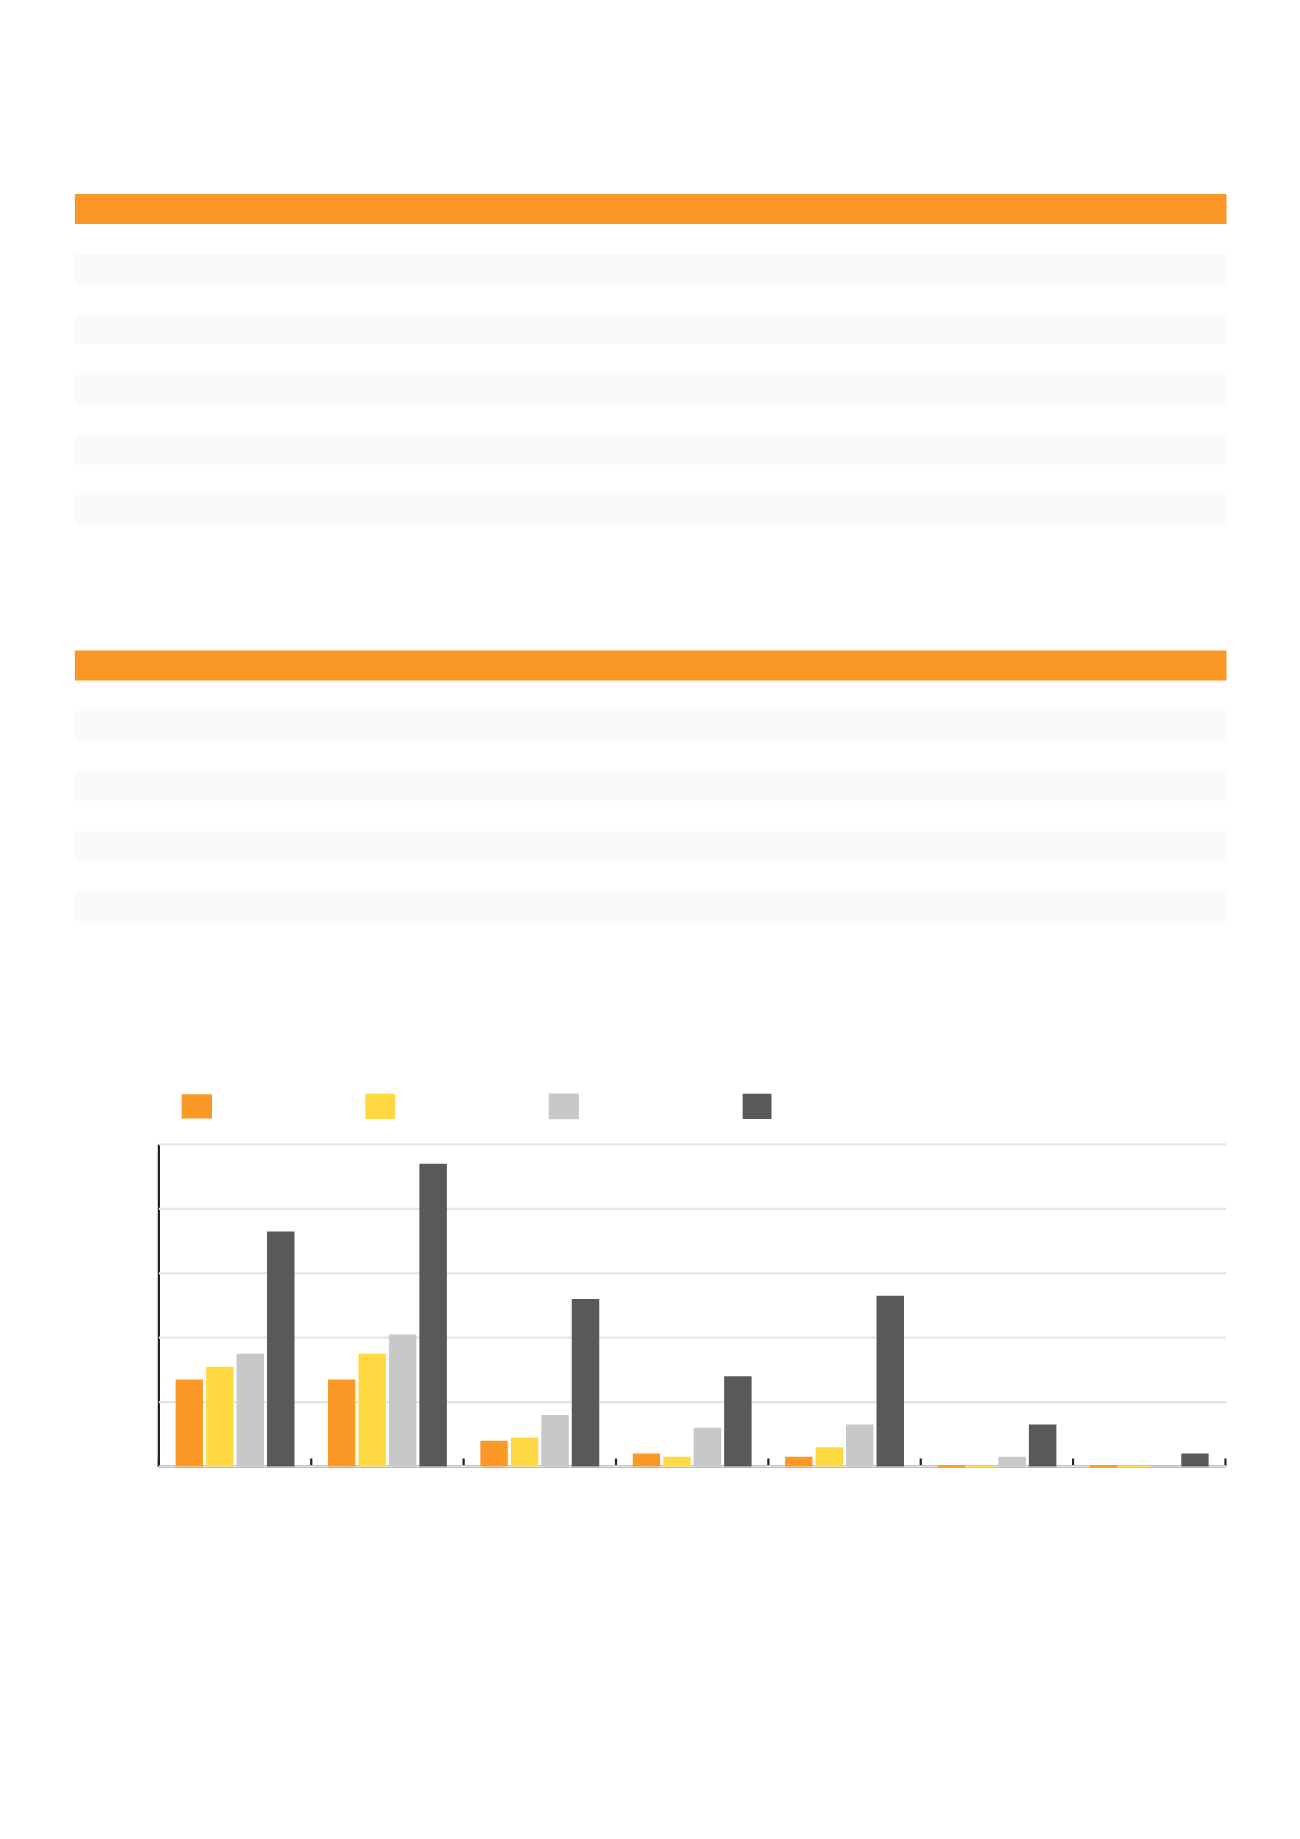
Chart 3. Black Type Races by State
listed
group 3
group 2
group 1
races
0
20
40
60
80
100
Act
tAs
WA
sA
QlD
Vic
nsW


