AUSTRALIAN RACING FACT BOOK 2012/13 11
Racing
Prizemoney
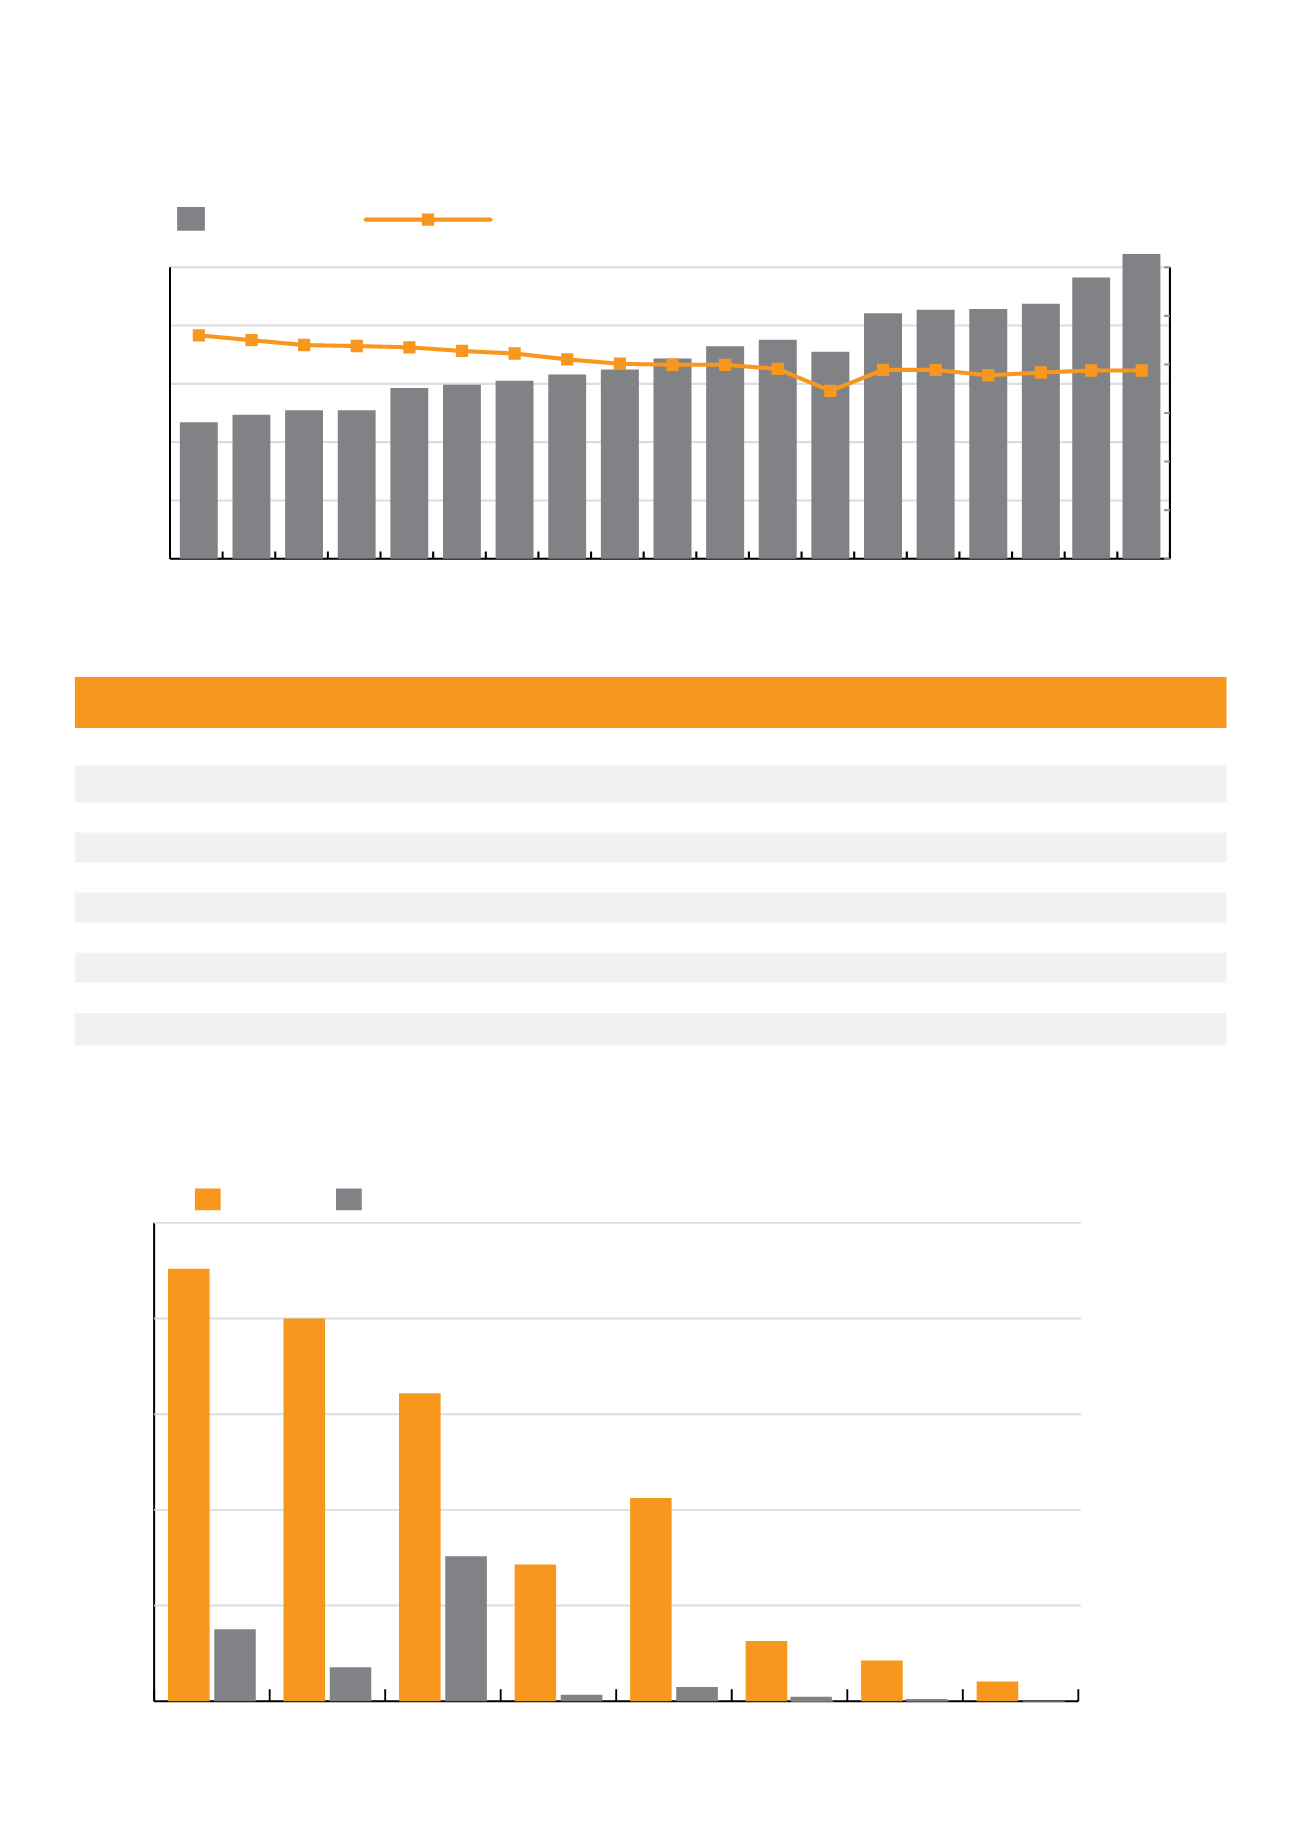
CHART 1. PRIZEMONEY VS RACES 1994/95 – 2013/14
CHART 2. TAB RACES VS NON - TAB RACES 2013/14
TABLE 3. PRIZEMONEY & INCENTIVE PAYMENTS IN AUSTRALIA 1993/94 – 2013/14
Additional Racing information and Statistics can be sourced from
Season Prizemoney
% Change
Incentive Scheme
Payouts
% Change
Season Prizemoney
% Change
Incentive Scheme
Payouts
% Change
2013/14 $509,566,525
4.26%
$31,880,272
7.82%
2003/04 $324,586,453
2.74%
$19,597,042
26.11%
2012/13 $488,709,074
12.25% $29,567,694
6.92%
2002/03 $315,933,356
3.49%
$15,539,310
20.86%
2011/12 $435,385,165
1.64%
$27,653,332
2.05%
2001/02 $305,293,254
2.24%
$12,857,434
0.84%
2010/11 $428,339,959
1.00%
$27,097,630
4.83%
2000/01 $298,592,625
1.95%
$12,750,456
3.11%
2009/10 $427,245,771
1.46%
$25,848,180
7.17%
1999/00 $292,869,666
7.18%
$12,365,670
6.95%
2008/09 $421,095,890
18.60% $24,118,081
26.19% 1998/99 $254,881,377
7.21%
$10,578,296
9.30%
2007/08 $355,043,530
-5.45% $19,112,670
5.11%
1997/98 $254,881,377
3.18%
$10,578,296
12.61%
2006/07 $375,512,579
2.97%
$18,183,678
-6.16% 1996/97 $247,036,322
5.56%
$9,393,801
57.82%
2005/06 $364,681,731
6.15%
$19,378,075
5.04%
1995/96 $234,020,189
6.13%
$5,952,192
191.51%
2004/05 $343,550,700
5.84%
$18,448,469
-5.86% 1994/95 $220,497,827
9.61%
$2,041,822
11.91%
0
5,000
10,000
15,000
20,000
25,000
30,000
0
$100,000,000
$200,000,000
$300,000,000
$400,000,000
$500,000,000
Prizemoney
11/12 12/13 13/14
10/11
09/10
08/09
07/08
06/07
05/06
04/05
03/04
02/03
01/02
00/01
99/00
98/99
97/98
96/97
95/96
Races
Races
0
1000
2000
3000
4000
5000
Non TAB Races
TAB Races
ACT
NT
TAS
WA
SA
QLD
VIC
NSW


