30
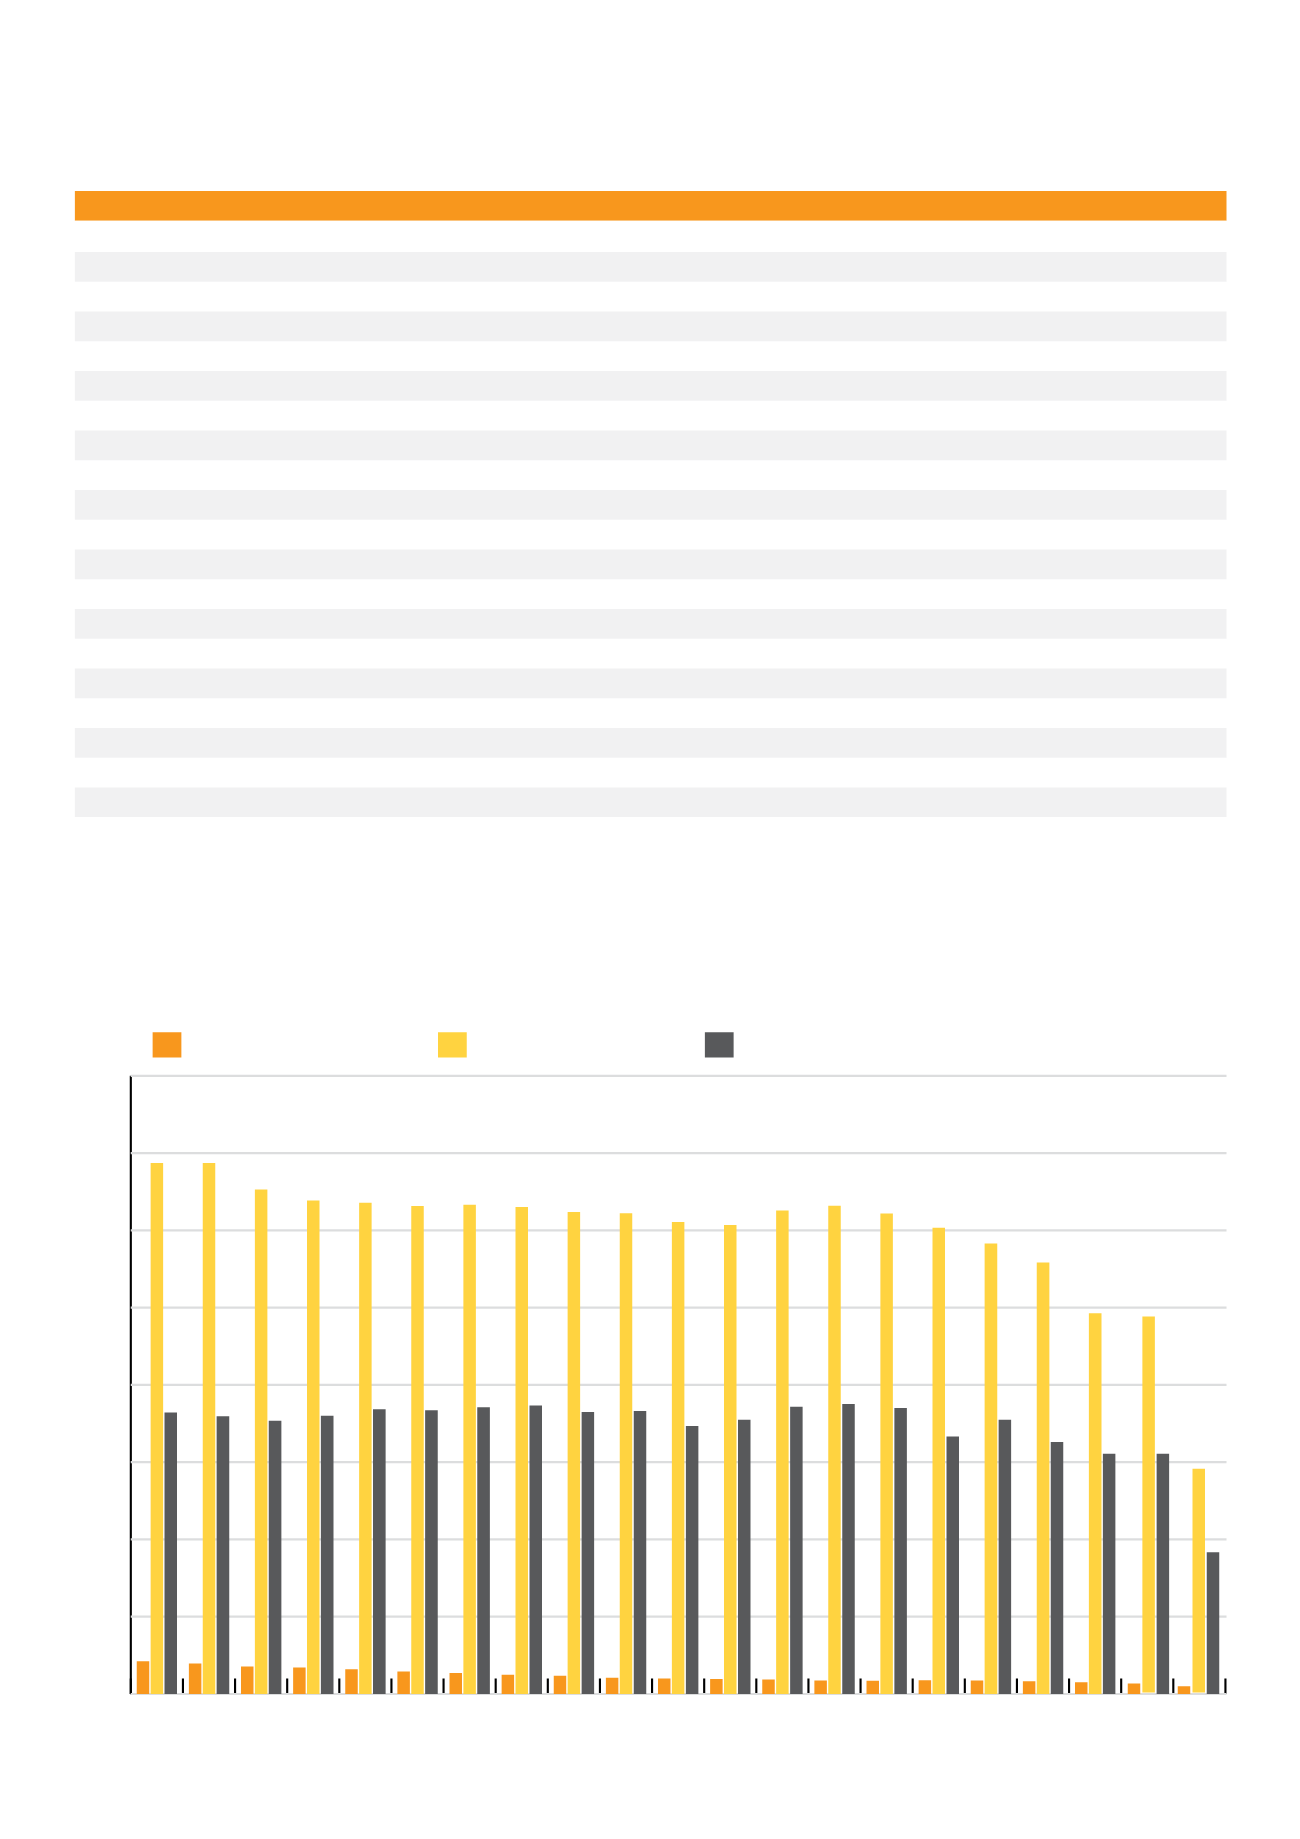
TABLE 21. BREEDING FIGURES 1993/94 – 2013/14
CHART 4. BREEDING TRENDS
Breeding
Statistics
Season
Stallions Returned
Mares Returned
Mares Covered
Live Foals
Live Foals / Mares Returned %
2013/14* 676
14,784
20,245
9,068
61.3%
2012/13
728
23,082
21,273
14,273
61.8%
2011/12
790
24,303
22,563
14,603
64.0%
2010/11
823
27,002
24,190
16,089
66.0%
2009/10
871
28,520
24,612
16,411
67.0%
2008/09
891
29,593
26,623
17,779
67.0%
2007/08
859
30,482
24,584
16,687
68.0%
2006/07
879
31,100
26,861
18,502
59.5%
2005/06
939
31,596
27,171
18,758
59.4%
2004/05
967
31,296
26,606
18,592
59.4%
2003/04
994
30,351
25,526
17,742
58.5%
2002/03
1,046
30,543
25,225
17,338
56.8%
2001/02
1,183
31,115
26,694
18,310
58.8%
2000/01
1,241
31,193
26,272
18,244
58.5%
1999/00
1,356
31,508
26,685
18,671
59.3%
1998/99
1,457
31,663
26,354
18,550
58.6%
1997/98
1,607
31,712
27,234
18,351
57.9%
1996/97
1,708
31,911
27,201
18,510
58.0%
1995/96
1,776
32,011
26,983
18,065
56.4%
1994/95
1,933
32,206
27,582
17,592
54.6%
1993/94
2,091
32,897
28,366
17,947
54.6%
Source
Please note: All figures are correct as of 14 October 2014.
* Figures current up to 8 September 2014.
0
5000
10000
15000
20000
25000
30000
35000
40000
2011/12
2012/13
2013/14*
2010/11
2009/10
2008/09
2007/08
2006/07
2005/06
2004/05
2003/04
2002/03
2001/02
2000/01
1999/00
1998/99
1997/98
1996/97
1995/96
1994/95
1993/94
Stallions Returned
Mares Returned
Live Foals


