74
Table 91. International Group & Listed Races by Country 2012/13
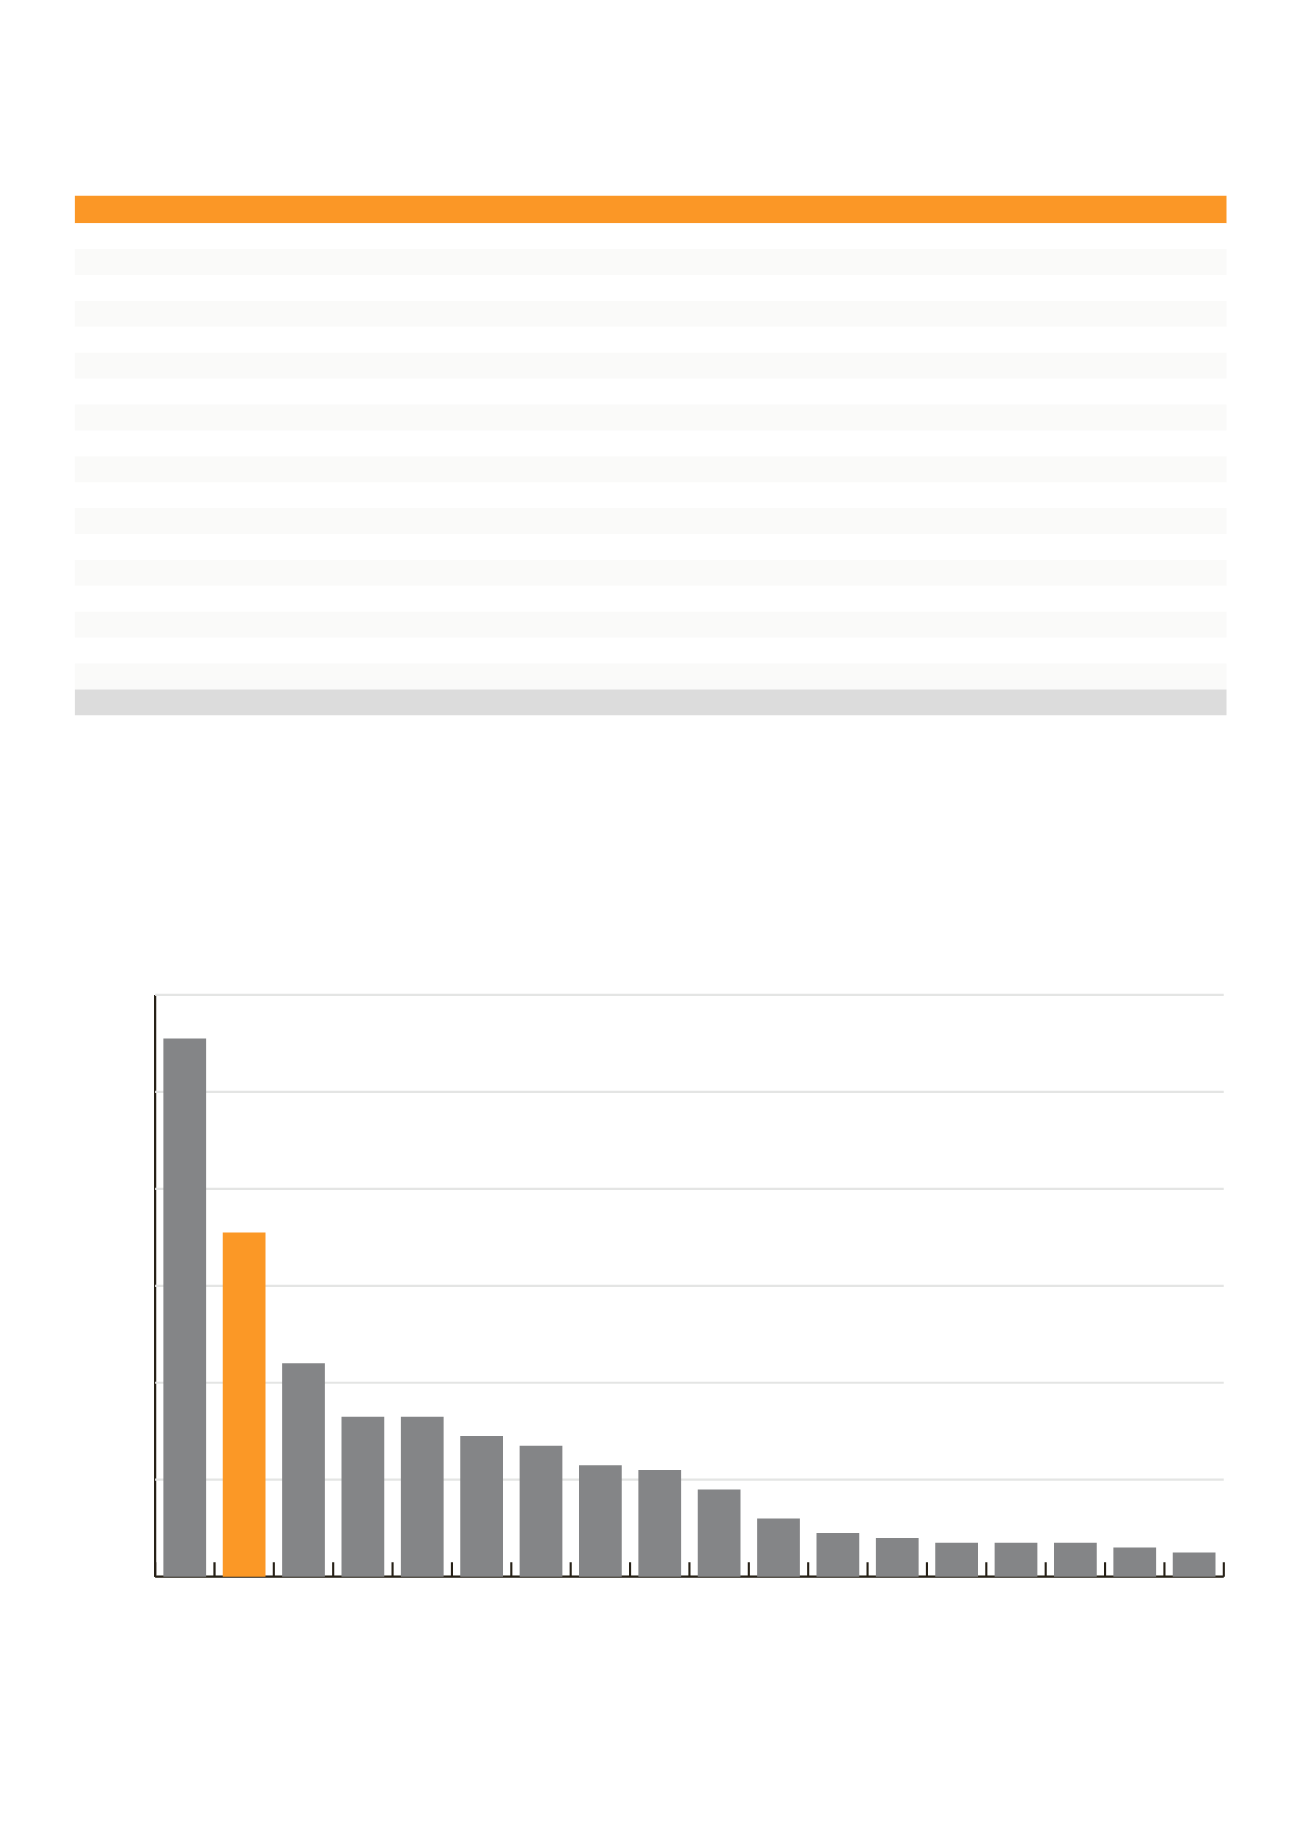
Chart 19. International Group 1 Races
Country
G1
%
G2
%
G3
%
L
%
Total
Flat Races
%
Argentina
44
20
51
23.18
60
27.27
65
29.54
220
5,558
3.95
Australia
71
12.07
88
14.96
147
25
282
47.95
588
19,534
3.01
Brazil
29
16.76
32
18.49
43
24.85
69
39.88
173
4,153
4.16
Canada
5
7.93
15
23.80
23
36.50
21
33.33
63
4,295
1.46
Chile
18
18.94
22
23.15
23
24.21
32
33.68
95
4,821
1.97
France
27
11.29
27
11.29
57
23.84
128
53.55
239
4,878
4.89
Germany
7
7.69
10
10.98
27
29.67
47
51.64
91
1,314
6.92
Great Britain
33
11.41
44
15.22
70
24.22
142
49.13
289
6,107
4.73
Hong Kong
9
36
4
16
12
48
0
0
25
769
3.25
Ireland
12
10.52
7
6.14
44
38.59
51
44.73
114
1,084
10.5
Italy
7
7.95
5
5.68
18
20.45
58
65.90
88
3,160
2.78
Japan
23
10.36
35
15.76
66
29.72
98
44.14
222
16,717
1.32
New Zealand
22
15.17
22
15.17
36
24.82
65
44.82
145
2,949
4.91
Peru
8
14.81
11
20.37
15
27.77
20
37.03
54
2,143
2.51
Singapore
6
21.42
6
21.42
16
57.14
0
0
28
93
30.1
South Africa
33
16.58
38
19.09
50
25.12
78
39.19
199
3,833
5.19
UAE
7
20
10
28.57
10
28.57
8
22.85
35
320
10.9
USA
111
16.97
148
22.62
198
30.27
197
30.12
654
44,929
1.45
Total
470
14.20
571
17.30
888
26.54
1,396
40.96
3,324
126,657
2.62
International
Racing
Source: Australian Racing Board
0
20
40
60
80
100
120
group 1 races
canada
singapore
uAE
italy
germany
Peru
Hong kong
ireland
chile
new Zealand
Japan
France
Brazil
south Africa
great Britain
Argentina
Australia
usA


