Australian Racing Fact Book 2012/13 55
Table 60. Number of Individual Runners per Season 2001/02 – 2012/13
Table 61. Number of Starters per Season 2001/02 – 2012/13
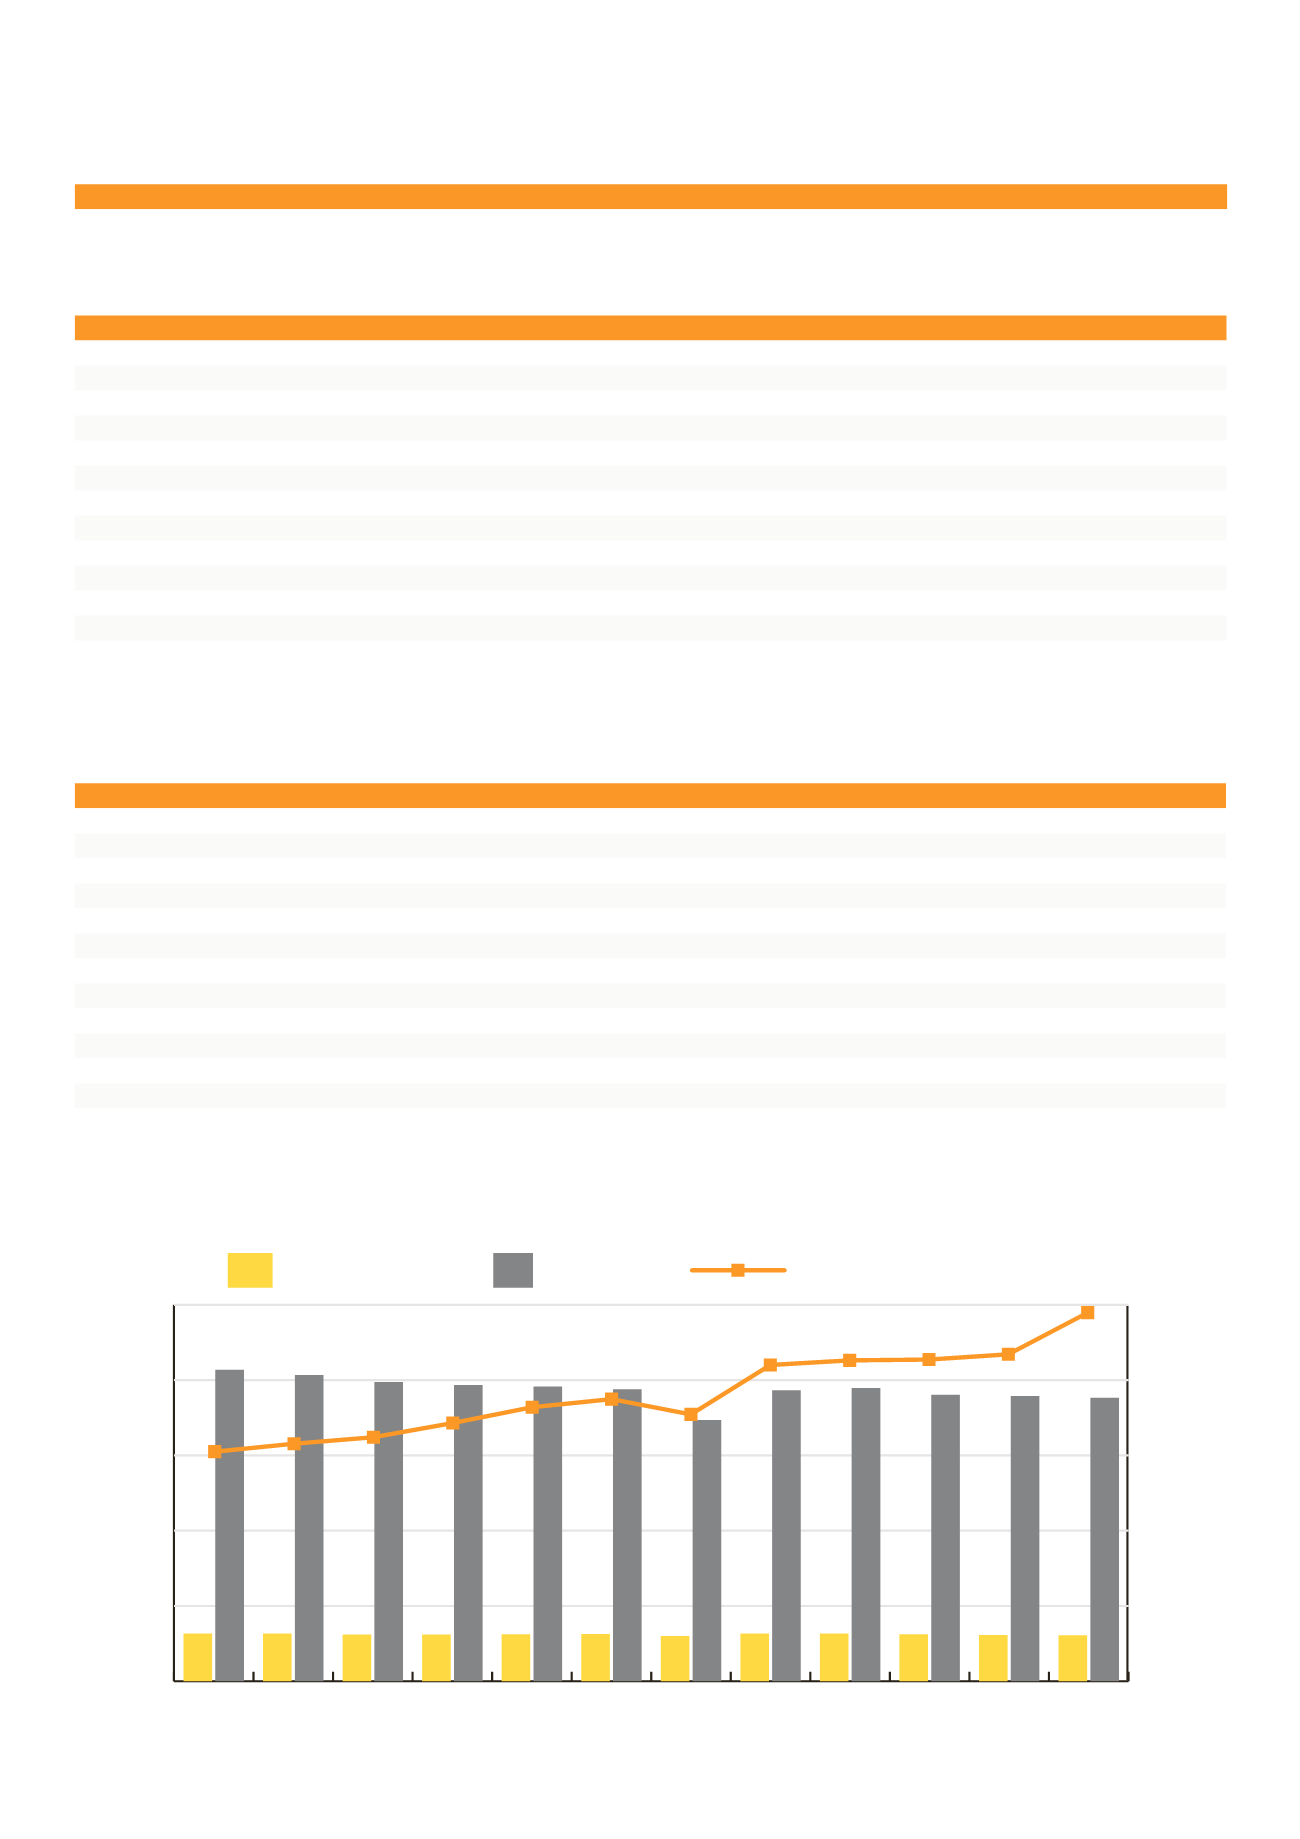
Chart 12. Number of Individual Runners, Starters & Prizemoney 2000/01 –2012/13
Starting
Trends
Year
NSW
VIC
QLD
SA
WA
TAS
NT
ACT
Australia
2012/13 54,447
43,111
42,116
13,853
23,450
5,905
3,459
1,985
188,326
2011/12 53,552
42,919
42,772
14,609
23,965
6,178
3,611
1,809
189,415
2010/11 52,542
43,113
43,240
15,052
24,021
6,403
3,552
2,335
190,258
2009/10 55,081
44,165
46,311
14,411
23,290
5,893
3,515
2,070
194,736
2008/09 54,800
44,066
46,060
14,189
22,903
6,171
3,320
1,740
193,249
2007/08 41,955
45,466
38,382
14,416
22,157
6,712
3,208
1,245
173,541
2006/07 54,220
45,630
47,024
14,584
21,932
6,302
3,171
1,143
194,006
2005/06 54,870
47,154
46,902
14,718
21,329
6,101
3,017
1,629
195,720
2004/05 54,116
47,123
47,933
14,900
21,611
6,096
3,104
1,800
196,683
2003/04 56,796
47,397
48,307
15,480
21,737
5,868
3,224
*
198,809
2002/03 56,773
49,144
51,534
15,176
21,170
6,371
3,143
*
203,311
2001/02 59,201
48,861
52,210
15,207
22,274
6,032
3,085
*
206,870
Year
NSW*
VIC
QLD
SA
WA
TAS
NT
ACT
Australia
Duals
2012/13 10,812
8,957
7,336
2,998
4,053
1,065
662
1,022
30,489
6,416
2011/12 10,621
9,010
7,377
3,227
4,086
1,068
673
994
30,757
6,299
2010/11 10,490
9,020
7,724
3,235
4,162
1,114
637
1,169
31,181
6,370
2009/10 10,924
9,106
8,152
3,127
3,989
1,077
621
1,079
31,773
6,302
2008/09 10,037
9,224
8,160
3,033
3,806
1,118
615
940
31,659
5,274
2007/08 8,963
8,987
7,365
3,061
3,622
1,136
595
*
29,972
3,757
2006/07 10,754
9,335
8,314
3,268
3,540
1,093
587
*
31,420
5,471
2005/06 10,842
9,485
8,217
3,177
3,366
1,009
575
*
31,248
5,423
2004/05 10,645
9,315
8,291
3,152
3,307
1,008
538
*
31,037
5,219
2003/04 10,750
9,245
8,255
3,281
3,234
1,008
564
*
31,126
5,211
2002/03 10,710
9,539
8,564
3,188
3,163
1,010
584
*
31,640
5,118
2001/02 10,973
9,466
8,584
3,256
3,251
980
541
*
31,702
5,349
Table 59. Horses by Number of Wins for the 2012/13 Season
Year
0
1
2
3
4
5
6
7
8
9
10+
2012/13
18,355
7,304
3,020
1,168
454
131
39
12
4
2
0
*NSW figures include the ACT
Note: Runners that have raced in more than one state are counted in each state total
*Indicates ACT figure is included in NSW
runners / starters
starters
Prizemoney
individual runners
0
$100,000,000
$200,000,000
$300,000,000
$400,000,000
$500,000,000
0
50,000
100,000
150,000
200,000
250,000
2012/13
2011/12
2010/11
2009/10
2008/09
2007/08
2006/07
2005/06
2004/05
2003/04
2002/03
2001/02


